Monday, February 28, 2022

Ukrainian Ambassador to the U.N. Sergiy Kyslytsya Remarks at U.N. General Assembly Emergency Meeting


Ukrainian Ambassador to the U.N. Sergiy Kyslytsya delivers remarks at U.N. General Assembly Emergency Meeting on the Russian Invasion of Ukraine. This is the first emergency meeting of the U.N. General Assembly since 1982. Full video here:

< […]
Read More

What the Digital SAT Will Mean for Students and Educators

The SAT has long been a rite of passage for high school seniors looking to attend college. Well, as readers may know, the College Board last month announced that the test is being revised and will be offered only in a digital format by spring 2024. Curious about what this means for students, educators, and the college-admissions process, I reached out to Priscilla Rodriguez, VP of college-readiness assessments at the College Board, where she is charged with managing the SAT. Here’s what she had to say.

Rick Hess: After all the disruptions of the pandemic and with so many colleges going “test optional,” where does the SAT stand today?

Priscilla Rodriguez

Priscilla Rodriguez: When nearly every U.S. college went test optional during the pandemic, millions of students still took the SAT. In fact, participation has grown with the high school class of 2022 compared with the class of 2021. And in the class of 2021, 62 percent of the students who took the SAT participated in our SAT School Day program in which we partner with states, districts, and schools to offer the SAT at no cost to students at their school during the school day. That’s the highest percentage of any class so far.

Hess: The College Board recently announced that the SAT will be fully digital by 2024. What will that mean in practice?

Rodriguez: The SAT will be delivered digitally internationally beginning in spring 2023 and in the U.S. in spring 2024. With the changes we’ve announced, the digital SAT will be easier to take, easier to give, and more relevant. We’re not simply putting the current SAT on a digital platform—we’re taking full advantage of what delivering an assessment digitally makes possible.

Hess: What are a couple of the big changes?

Rodriguez: The digital SAT will be shorter—about two hours instead of three, with more time per question. The digital test will feature shorter reading passages with one question tied to each, and passages will reflect a wider range of topics that represent the works students read in college. Calculators will be allowed on the entire math section. Students and educators will get scores back in days, instead of weeks. And, to reflect the range of paths that students take after high school, digital SAT score reports will also connect students to information and resources about local two-year colleges, workforce-training programs, and career options.

Hess: You note that the test will take less time, feature shorter passages, and allow calculators. Some have asked whether this suggests the test is becoming less rigorous. What’s your take on such concerns?

Rodriguez: The SAT will continue to measure the knowledge and skills that students are learning in high school and that research shows matter most for college and career readiness. It will cover the same content domains and still require critical-thinking skills to answer questions successfully. And it will continue to be predictive of college success. What we’re doing with these changes is providing students with a way to show what they have learned.

Hess: How will the changes you’re talking about affect the security of the test?

Rodriguez: The changes will make the SAT more secure. With the current paper and pencil SAT, if one test form is compromised, it can mean canceling administrations or canceling scores for a whole group of students. Going digital allows every student to receive a unique test form, so it will be practically impossible to share answers.

Hess: And what are a couple key things that will be staying the same?

Rodriguez: The SAT will still be scored on a 1600 scale. The assessment will continue to be administered in a school or in a test center with a proctor present—not at home. Students will still have access to free practice resources on Khan Academy. And students taking the SAT will continue to connect to scholarships and the College Board National Recognition Programs.

Hess: How long have these changes been in the works?

Rodriguez: While we had been moving toward offering a digital SAT for a number of years, the pandemic has accelerated our transition. Students are now doing more of their learning and testing digitally, and the SAT shouldn’t be the exception. In November, we piloted the digital SAT in the U.S. and internationally, and the feedback validated our decision to make these changes—80 percent of students responded that they found it to be less stressful. The digital SAT is very much aimed at taking pressure off students and giving them the opportunity to demonstrate what they know.

Hess: There’s been a highly publicized shift of some colleges to “test optional” admissions. How has that affected the SAT?

Rodriguez: When viewed within the context of where a student lives and learns, test scores can confirm a student’s grades or demonstrate their strengths beyond what their high school grades may show. In the class of 2020, nearly 1.7 million U.S. students had SAT scores that confirmed or exceeded their high school GPA. That means that their SAT scores were a point of strength on their college applications. Among those students, more than 300,000 were from small towns and rural communities; 600,000 were first-generation college goers; and 700,000 were Black or Latino. And, when surveyed, 83 percent of students said they want the option to submit test scores to colleges. Students want to take the SAT, find out how they did, and then decide if they want to submit their scores to colleges.

Hess: Some critics charge that the SAT favors the affluent, while others argue it was created explicitly to provide a less subjective measure of student readiness. Can you say a few a words about your own feelings on this score?

Rodriguez: The SAT allows every student—regardless of where they go to high school—to be seen and to access opportunities that will shape their lives and careers. I am one of those students. I’m a first-generation American, the child of immigrants who came to the U.S. with limited financial resources, and I know how the SAT opened doors to colleges, scholarships, and educational opportunities that I otherwise never would have known about or had access to. We want to keep those same doors of opportunity open for all students. In designing the digital SAT, we’ve focused on access and equity. All students can receive free practice on Khan Academy; if students don’t have a device to use, the College Board will provide one for use on test day; and more students will benefit from the opportunities provided through the SAT School Day program.

Hess: What’s the most important thing for K-12 educators to know about the change?

Rodriguez: In the November pilot, 100 percent of the 98 participating educators reported having a positive experience. Educators will no longer have to deal with packing, sorting, or shipping test materials. And with changes that make the SAT shorter and easier to administer, states, districts, and schools will have more options for when, where, and how often they administer the SAT—rather than adhering to a fixed schedule. These improvements are especially important because students from all backgrounds increasingly are taking the SAT during the school day, and independent research from the Brookings Institution shows the benefits of universal school day testing.

This interview has been edited and condensed for clarity.

Frederick Hess is director of education policy studies at the American Enterprise Institute and an executive editor of Education Next.

This post originally appeared on Rick Hess Straight Up.

The post What the Digital SAT Will Mean for Students and Educators appeared first on Education Next.

By: Frederick Hess
Title: What the Digital SAT Will Mean for Students and Educators
Sourced From: www.educationnext.org/what-the-digital-sat-will-mean-for-students-and-educators/
Published Date: Mon, 28 Feb 2022 10:01:29 +0000

News.... browse around here


<="" iframe="">


The Education Exchange: Atlanta’s Buckhead Neighborhood Mulls Leaving the City

A longtime reporter for the Atlanta Journal-Constitution, Maureen Downey, joins Paul E. Peterson to discuss the efforts of Atlanta neighborhood Buckhead to break away and form its own city, how it failed and what it could have meant for Atlanta Public Schools and its students.

The post The Education Exchange: Atlanta’s Buckhead Neighborhood Mulls Leaving the City appeared first on Education Next.

By: Education Next
Title: The Education Exchange: Atlanta’s Buckhead Neighborhood Mulls Leaving the City
Sourced From: www.educationnext.org/the-education-exchange-atlantas-buckhead-neighborhood-mulls-leaving-the-city/
Published Date: Mon, 28 Feb 2022 09:59:07 +0000

News.... browse around here


<="" iframe="">


Saturday, February 26, 2022

NATO Secretary General: "This is a brutal act of war...Peace on our continent has been shattered."


NATO Secretary General Jens Stoltenberg: "Russia has attacked Ukraine. This is a brutal act of war. Our thoughts are with the brave people of Ukraine. Sadly, what we have warned against for months has come to pass. Despite all calls on Russia to chan […]
Read More

U.S. Supreme Court Nominee Judge Ketanji Brown Jackson


Supreme Court Nominee Judge Ketanji Brown Jackson: "I must begin these very brief remarks by thanking God for delivering me to this point in my professional journey. My life has been blessed beyond measure, and I do know that one can only come this f […]
Read More

Ukrainian Ambassador: "I invite the Russian ambassador to pray for salvation."


Ukrainian Ambassador to the U.N. Sergiy Kyslytsya: "Last night was the most horrific for Kyiv since, just imagine, 1941 when it was attacked by Nazis."

He asks for a moment of silence "to pray, or to meditate if you do not believe in God, for […]
Read More

Washington Today (2-25-22): President Biden nominates Judge Ketanji Brown Jackson to Supreme Court


Today's program looks at President Biden's nomination of federal judge Ketanji Brown Jackson to the Supreme Court, U.S. sanctioning President Putin personally over Russia's invasion of Ukraine, and CDC revising indoor COVID-19 mask guidance.

D […]
Read More

Friday, February 25, 2022

President Biden nominates Judge Ketanji Brown Jackson to U.S. Supreme Court


President Biden: "Today, I'm pleased to nominate Judge Jackson who will bring extraordinary qualifications, deep experience and intellect and a rigorous judicial record to the Court. Judge Jackson deserves to be confirmed as the next justice of the S […]
Read More

"We are deploying elements of the NATO response force on land, at sea and in the air."


NATO Secretary General Jens Stoltenberg: "We must stand ready to do more, even if it means we have to pay a price because we are in this for the long haul...We are deploying elements of the NATO response force on land, at sea and in the air."

[…]
Read More

President Biden Statement on Russian Invasion of Ukraine


President Biden on Russian Invasion of Ukraine: "Putin is the aggressor. Putin chose this war and now he and his country will bear the consequences." Watch full video here:


Download the FREE C-SPAN Now App.

Discover the C-SPAN Vi […]
Read More

Washington Today (2-24-22): POTUS details new Russian sanctions for invading Ukraine


Today's program looks at Russia's invasion of Ukraine and new sanctions on Russia by the U.S. and Great Britain, and Gov. Ron DeSantis (R-FL) speaks to CPAC. Interview with AP's Treasury Dept reporter Fatima Hussein (8).

Download the FREE C-SP […]
Read More

Thursday, February 24, 2022

The Weekly Podcast: Killing Terrorist Leaders Right Before State of Union Address


With President Biden's State of Union address just days away, we look back at the 2020 State Of the Union address. Two years ago, President Trump discussed the killing of terrorist leader Qasem Soleimani -- and got big applause.

In his State o […]
Read More

U.N. Secretary General: "Give peace a chance."


U.N. Secretary-General António Guterres at U.N. Security Council Meeting: "I have only one thing to say from the bottom of my heart; President Putin, stop your troops from attacking Ukraine. Give peace a chance. Too many people have already died." Read More

"There is no purgatory for war criminals. They go straight to hell ambassador."


Ukrainian Ambassador to the U.N. Sergiy Kyslytsya: "There is no purgatory for war criminals. They go straight to hell ambassador."

Download the FREE C-SPAN Now App.

Discover the C-SPAN Video Library at

C-SPAN: Created by Cable […]
Read More

Wednesday, February 23, 2022

U.S. Ambassador Statement at U.N. Security Council Meeting


U.S. Ambassador to the U.N. Linda Thomas-Greenfield at UN Security Council meeting: "We’re here for one reason and one reason only; to ask Russia to stop, return to your borders. Send your troops and your tanks and your planes back to their barracks […]
Read More

Washington Today (2-23-22): Nord Stream 2 Pipeline is Target of Latest US. Sanction on Russia


Today's program looks at U.S. sanctions on Nord Stream 2 in response to Russia's military threats against Ukraine, trucker protest convoys head to DC and a Supreme Court case on former President Trump's immigrant "public charge" rule. Interview with […]
Read More

Speaker Pelosi on Putin: "This is the same tyrant who attacked our democracy in 2016."


House Speaker Nancy Pelosi on Russian President Putin: "It's stunning to see in this day and age a tyrant roll into a country. This is the same tyrant who attacked our democracy in 2016."

Full video here:

Download the FREE C-SPAN Now […]
Read More

Tuesday, February 22, 2022

Washington Today (2-22-22):President Biden sanctions Russia over "beginning of invasion" of Ukraine


Today's program looks at U.S. and Europe imposing additional sanctions on Russia for military action against Ukraine, President Biden on safeguarding the critical mineral supply chain and reaction to the guilty verdicts in the Arbery federal hate cri […]
Read More

President Biden Announces Sanctions on Russia


President Biden delivers a statement at the White House on Russia - Ukraine: "Who in the Lord's name does Putin think gives him the right to declare new so-called countries on territory that belong to his neighbors? This is a flagrant violation of in […]
Read More

The Education and learning Exchange: What Occurred in San Francisco?

Joanne Jacobs, an education reporter and former San Jose Mercury News editorial writer and columnist, joins Paul E. Peterson to discuss the recent recall of three members of the San Francisco Unified School Board.

Jacobs wrote about the effort to recall the board members for Education Next, in “Behind a School Board Recall in San Francisco, a Diverse Coalition.”

The post The Education Exchange: What Happened in San Francisco? appeared first on Education Next.

By: Education Next
Title: The Education Exchange: What Happened in San Francisco?
Sourced From: www.educationnext.org/education-exchange-what-happened-in-san-francisco-school-board-recall-election/
Published Date: Tue, 22 Feb 2022 15:28:05 +0000

News.... browse around here


<="" iframe="">


Major Differences

How expensive is a college degree? Usually, the answer is based on what students pay in tuition and fees compared to what they earn after graduation. As a result, policymakers often promote enrollment and applaud growth in tech-heavy programs that tend to produce high-earning graduates, like engineering and computer science—especially given the explosive growth in college prices, which have doubled in the past 30 years.

But that thinking only focuses on one side of the equation: the student’s private return on investment, based on the labor-market value of a degree relative to what the student paid. We know very little about the economic cost of running an electrical engineering program compared to, say, a history department, or the resource consequences of steering more students into these fields.

To fill this gap, we examine department-level data on expenditures, outputs, and factors of production for undergraduate, graduate, and professional degree programs at nearly 600 four-year institutions across the United States from 2000 to 2017. Our analysis compares the instructional costs per student credit hour at more than 8,000 departments in 20 disciplines, including both in-person and online study.

We establish five new facts about college costs. First, we find substantial cost differences across fields of study. On the whole, costs are higher in fields where graduates earn more and in pre-professional programs. Second, most of these patterns can be explained by differences in class size and, to a lesser extent, differences in average faculty pay. However, some fields with highly paid faculty, like economics, offset this with large classes.

Third, cost differences have evolved over time. Programs in some fields, such as mechanical engineering, chemistry, physics, and nursing, have shown steep annual declines in spending, while others like fine and studio arts, history, and political science have grown more expensive each year. Fourth, these trends are explained in part by a growing number of adjunct faculty as well as changes in class size and faculty teaching loads. Fifth, online instruction is not a cost-saver. It is neither more nor less expensive than in-person classes.

Our results underscore the potential wedge between the social and private returns to higher education. That is, the social return to investment in high-earning fields may be lower than wage premiums suggest, because high-return fields also tend to be more costly to teach. This highlights the need for policymakers to consider the cost implications of changes in the mix of fields students study.

In addition, our work suggests that while differences in production technology enable some departments to take different approaches to cost management, from changing the mix of faculty to increasing class size, online instruction does not have a meaningful association with college costs, at least in its current form. Any one-discipline-fits-all approach to addressing cost escalation in higher education, including moving more classes online, is likely to be ineffective.

Cost Drivers on Campus

Scholars have long noted the tendency for college costs to grow faster than the broader economy. Some argue that this is inevitable because postsecondary education is inherently labor-intensive and therefore has not benefitted from the kinds of productivity-enhancing innovations that have driven down costs in other industries. Other potential explanations include the proclivity of colleges to maximize revenue in an effort to compete for prestige, school spending on student amenities, and the expansion of unnecessary administrative positions.

In all cases, programs produce a set of outputs, such as undergraduate instruction or research publications, using a large set of inputs, such as faculty of different types, classrooms, office space, technology, and laboratories. The relationship between these varies across fields of study. Some disciplines require intense interaction between students and faculty to produce a given level of instructional quality—think of a debate-driven course with long extemporaneous papers to grade—while others require laboratory sessions that rely on expensive equipment and supplies. By contrast, other fields of study may be able to take advantage of economies of scale and scope, such as those that deliver “101”-style general-education courses for the entire institution. In addition, departments with undergraduate and graduate programs can tap graduate students to serve as lower-cost instructors. Such differences affect class size, faculty mix, faculty teaching load, and non-personnel expenditures—all of which determine the cost per unit of instruction.

Data and Method

To compare instructional costs by field of study, we use department-level data from 2000 to 2017 from University of Delaware,s Cost Study (also known as the National Study of Instructional Costs and Productivity). Instructional activity is measured by student credit hours, organized class sections, and faculty full-time equivalents. Student credit hours and class sections are disaggregated by instructor type, such as tenure track, supplemental, or teaching assistants, and by course level, such as lower-division undergraduate, upper-division undergraduate, and graduate. Finally, institutions report total direct expenditures for instruction, research, and public service and total undergraduate and graduate student credit hours for the entire academic year.

We work with direct instructional expenditures per student credit hour as our main measure of costs, which include salaries, benefits, and non-personnel expenses. In 2015, the study added a component to the survey to capture information about online instruction. These data contain information on online student credit hours by department at the undergraduate and graduate levels.

Institutional participation in the cost study is voluntary. Therefore, we assess how well our sample matched the broader universe of public and private nonprofit four-year institutions operating in the United States, based on the Integrated Postsecondary Education Data System. We estimate that our sample represents 23 percent of all degrees awarded between 1998 and 2015, including 32 percent of degrees at public institutions and 8 percent of degrees at private schools.

We focus on data collected from doctoral, master’s, and bachelor’s degree-granting institutions in the United States. Our analysis looks at 20 core fields of study, including the largest fields (collectively accounting for more than half of student credit hours) and fields that are particularly salient for institutional leaders and policymakers. Our final sample contains 43,819 institution-year observations from 8,221 departments in 20 disciplines at 594 institutions. The data for online programs beginning in 2015 include 3,358 unique departments from 20 disciplines at 238 institutions across 3 years.

Using these data, we construct variables that measure costs, outputs, and inputs. Our primary outcome of interest is direct instructional spending per student credit hour, which we construct by dividing annual instructional costs by annual student credit hours at the department level. We also calculate this ratio for the personnel expenditures portion of costs. Finally, to analyze the sources of differences in costs across programs, we calculate average class size based on fall credit hours, faculty per student, and faculty teaching load.

Instructional Costs Vary by Field of Study (Figure 1)

Differences by Degree Program

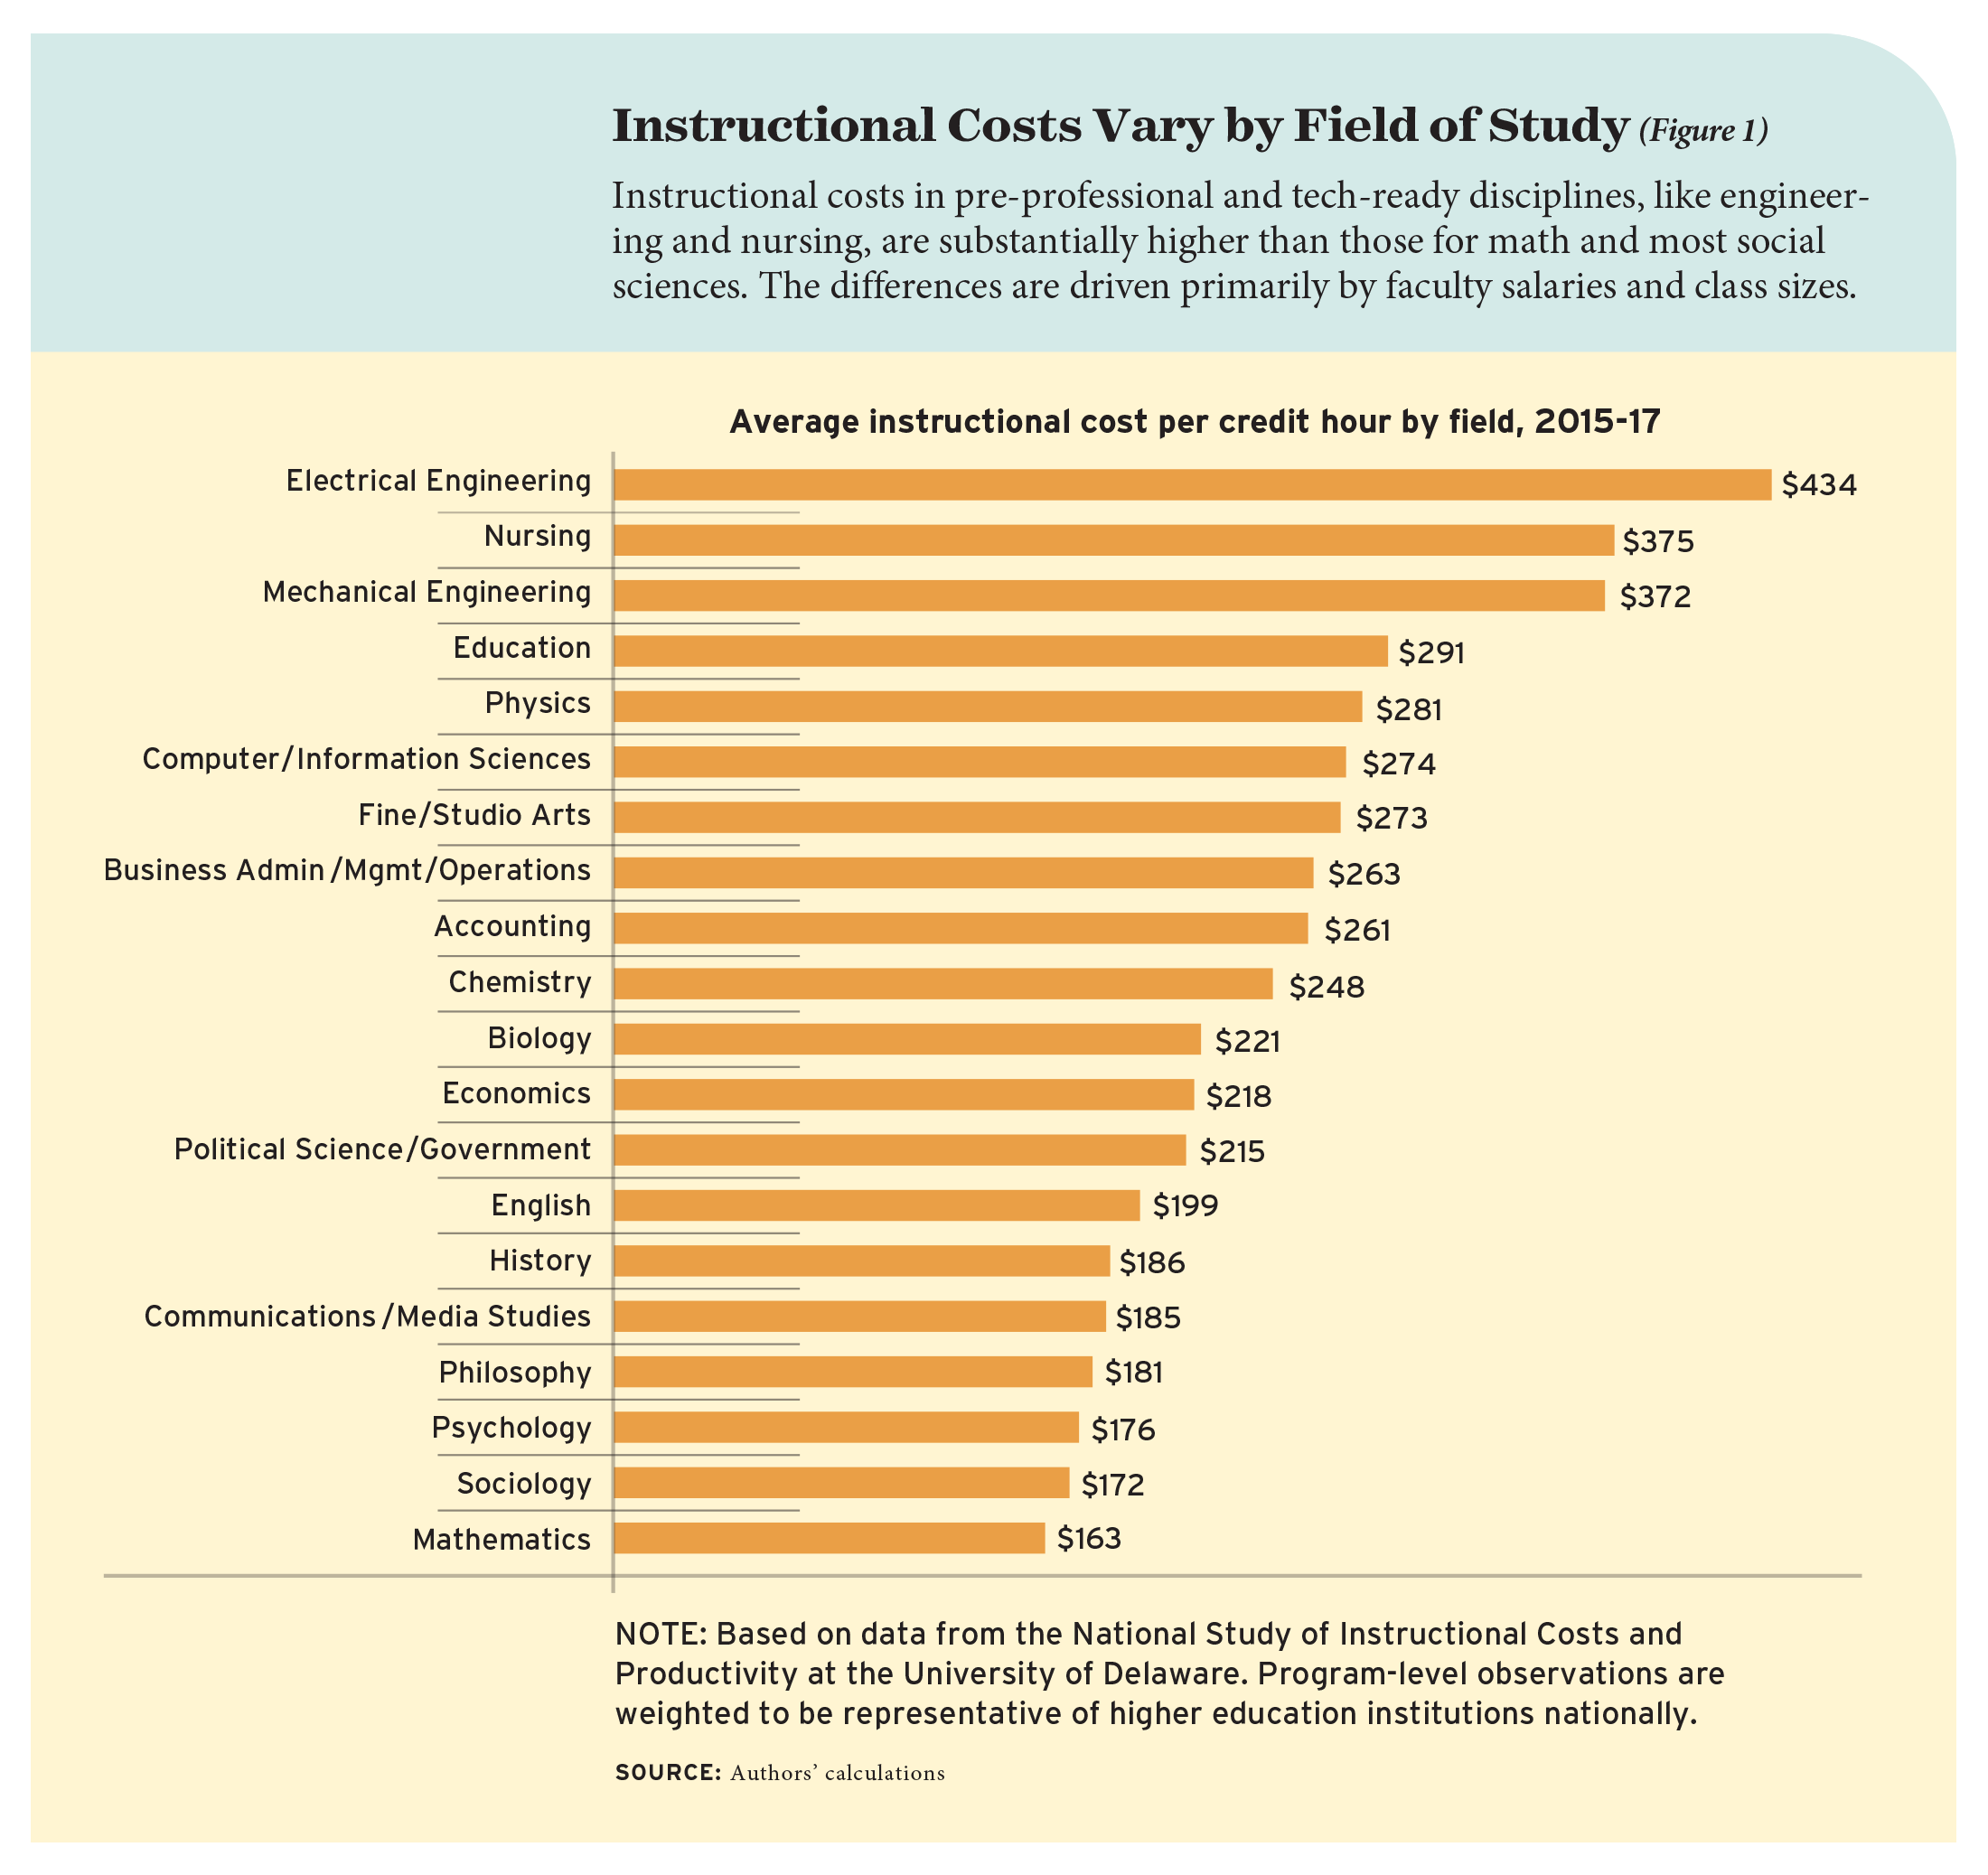
We find substantial variation across disciplines in average costs per student credit hour (see Figure 1). Costs range from about $434 per student credit hour in electrical engineering to $163 per hour in math. Our benchmark department, English, costs $199 per hour; the mean cost across the group of 20 fields is $228. Most social-science disciplines and philosophy are relatively less expensive, while science, technology, and pre-professional programs like nursing are more costly. This broad conclusion holds across all institutions—nursing is a more expensive program to operate at elite private research institutions and less selective public institutions alike.

To compare costs across fields of study, we use the English department as a benchmark and look at costs by discipline from 2015–17. First, we calculate the average direct instructional cost per student credit hour for English at each school. We then calculate the within-institution difference between direct instructional expenditures per student credit hour for each of the other 19 disciplines and the same measure for English. We do this for all institutions and disciplines in our sample and then compute averages for each field of study.

In many cases, we find higher instructional expenses in the fields that also produce higher-earning graduates. For example, at $434 per student credit hour, electrical engineering costs 90 percent more than English. In looking at research by Brad Hershbein and Melissa S. Kearney, we see that adults with electrical engineering degrees have substantially higher average salaries throughout their careers. One year after graduation, electrical engineering majors earn more than double the average salary paid to English majors, or $63,000 compared to $31,000. Some 15 years later, that difference is about 83 percent, or $106,000 compared to $58,000.

There are several exceptions to these overall patterns. Math costs about 25 percent less than English, yet adults with mathematics or statistics degrees still earn more: $45,000 one year after graduation, a difference of 45 percent, and $76,000 in year 16, a difference of 32 percent.

In addition, education and fine and studio arts are among the most costly programs to operate, yet their graduates are also among the lowest paid. Education costs about $291 per credit hour, about 45 percent more than English. But adults with degrees in elementary education earn less than English majors throughout most of their careers—in year 16, they earn $44,000 compared to $58,000, a difference of about 35 percent. Similarly, fine and studio arts instruction costs about $273 per credit hour, but arts majors earn about the same or slightly less than English majors, on average: both graduates earn $31,000 one year after graduation. Some 15 years later, arts majors earn $55,000 versus $58,000 for adults with English degrees.

We also look at the growth in the number of student credit hours in each field during the study period of 2000–2017 and find that, on the whole, enrollment is growing fastest in some of the more costly fields. The highest annual rates of growth are in nursing, at 5.4 percent, and mechanical engineering, at 4.9 percent. Meanwhile, we also see that student credit hours are declining in four fields: English, history, education, and fine and studio arts. If those higher costs were associated with challenges in dynamically adjusting inputs, such as instructors and course sections, we would expect that fast-growing fields would have lower costs than slow-growing or declining ones. In fact we see the opposite.

More costly fields also are more likely to have access to additional revenue sources than English departments. Almost all of the most expensive fields are typically housed in separate schools from English, such as colleges of engineering, business, and education. This permits them to generate additional revenue through differential tuition bills or fees, and through separate fundraising efforts from alumni or industry. In some cases, these fields also have access to dedicated state appropriations for instructional costs. For example, in Texas and North Carolina, programs in the sciences, engineering, and nursing are eligible for more public support than programs in the liberal arts and social sciences.

Variety in Cost Contributors Across Fields of Study

We next investigate the factors behind these cost differences, looking at faculty salaries, class sizes, faculty workload—defined as the number of organized class sections divided by the number of full-time equivalent faculty—and non-personnel costs like equipment and supplies.

Instructional cost differences across fields can mostly be explained by large differences in class size across disciplines and, to a lesser extent, differences in average faculty pay. Teaching loads and other non-personnel expenditures explain relatively little.

Instructional Style

Although each field is slightly different, a few general patterns emerge. Economics, political science, accounting, and business have high faculty salaries that are mostly offset by large classes. Engineering and nursing are more expensive than English as a result of higher faculty salaries and lower teaching loads without commensurately larger classes. Workload and non-personnel expenses are important for some of the sciences with laboratory components—namely, biology and chemistry—but otherwise explain relatively little of the observed cost differences.

Consider economics, which is approximately 8 percent less expensive than English. Economics faculty are more highly paid than English professors. Postsecondary English instructors earn about 54 percent less than economics professors, with mean annual wages of $80,340 a year compared to $123,720. Thus if all cost drivers other than average pay were equalized between the two fields, economics would be more expensive. On the other hand, economics classes tend to be much larger than English classes, so class-size differences would make economics instruction less expensive. The faculty workload is a little lighter in economics than in English, so if that were the only driver of cost differences, economics would be about 3 percent more expensive.

Putting these findings together, we see that economics departments are able to field classes that are large enough to more than offset the higher salary and slightly lower workload of economics faculty, resulting in slightly lower average costs than English. Yet economics graduates earn substantially more: one year after graduation, the average salary is $48,000, or about 55 percent more than English majors. Fifteen years later, that difference grows to about 83 percent, or $106,000 for economics majors compared to $58,000 for adults with English degrees.

Mechanical engineering, a fast-growing field that is 62 percent more expensive than English, provides a counterexample. Engineering instructors have mean annual wages of $114,130, about 43 percent more than English instructors, as well as lower teaching loads than English faculty. As a result, the average difference in faculty pay across these two fields contributes substantially to the overall cost difference. Unlike economics, however, classes are only modestly larger in mechanical engineering than in English. Class-size differences are not large enough to offset the higher salary and lower teaching load, and thus mechanical engineering remains much more expensive than English. Research shows wide differences in earnings for mechanical engineering graduates compared to adults with English degrees: $60,000 one year after graduation, a difference of about 95 percent, and $104,000 some 15 years later, a difference of about 80 percent.

Differences in Tenure-Track Faculty Across Disciplines (Figure 2)

Faculty Type and Class Size

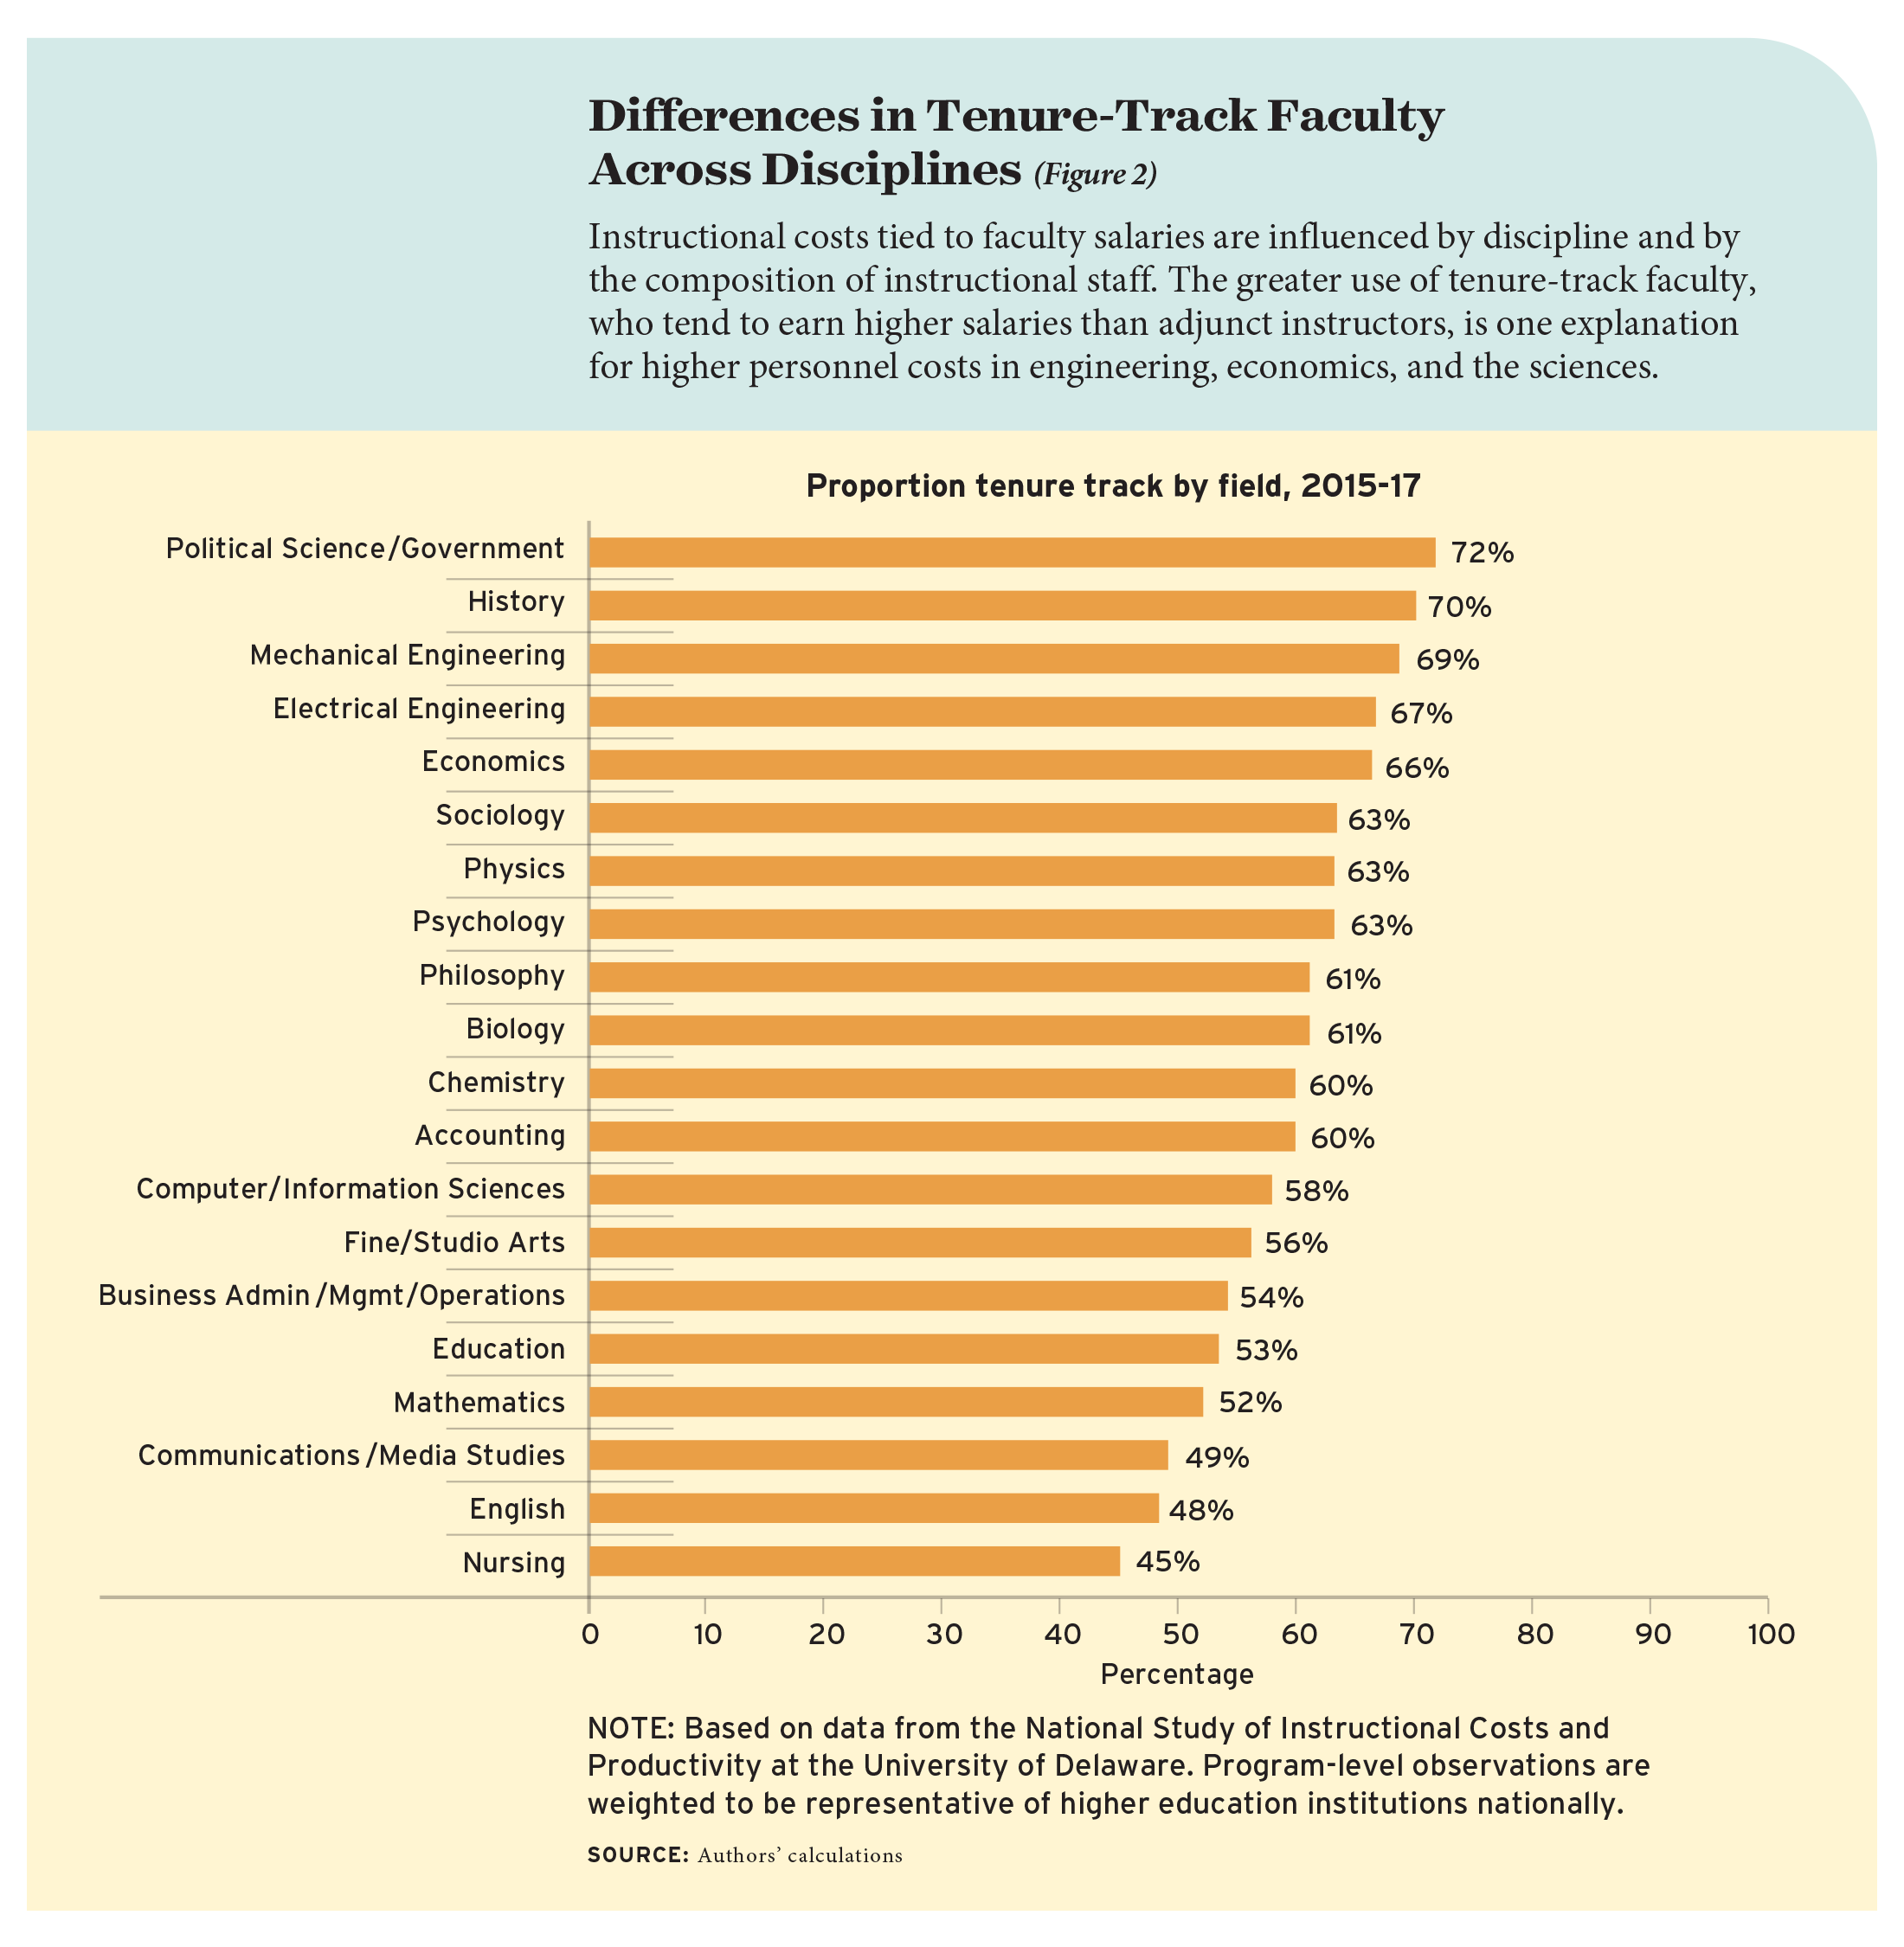
A department’s faculty salaries are driven by the mix of tenure-track and adjunct instructors as well as the salary for that particular discipline. We find quite a bit of variation in the share of tenure-track faculty by field (see Figure 2). In nursing, nearly 60 percent of instructors are not on the tenure track, while in mechanical and electrical engineering, three quarters of faculty are in tenure-track roles. English, communications, and math also have relatively low shares of tenure-track faculty. Thus, greater use of tenure-track faculty, which is more expensive, is one explanation for higher personnel costs in engineering, economics, and the sciences. Across the board, we see declines in the share of tenure-track faculty during the study period, with departments relying more on lower-cost adjunct instructors.

The second key cost driver, beyond faculty salaries, is class size. Differences in class size are a function of the mix of course types offered, such as lower-level undergraduate, upper-level undergraduate, and graduate, as well as the average class size for those courses. Lower-level classes tend to be larger and therefore less costly, whereas upper-level and graduate courses have smaller class sizes and are therefore more expensive.

We find substantial differences in the mix of course types offered, with relatively fewer lower-division courses in professional fields like education and business, and many lower-division courses in mathematics and science disciplines like physics and chemistry. Fields with relatively little undergraduate instruction, like engineering and nursing, tend to be more expensive. Looking over the study period, we find average class size conditional on level of course is fairly steady for most fields in the social sciences and humanities, in contrast to marked increases in undergraduate class sizes in engineering and biology.

Trends Over Time

We consider the average annual change in instructional costs for each of our 20 fields of study by looking at pieces attributable to changes in faculty salaries, class sizes, faculty workload, and other expenses. Across many fields, changes in faculty salaries and class sizes account for the bulk of the changes in instructional costs between 2000 and 2017. For instance, mechanical engineering saw a 2.10 percent reduction in cost each year, which is more than fully explained by an increase in class size. Costs for accounting rose by 0.64 percent annually, driven by faculty salary growth of 1.43 percent that outpaced increases in workload and class size. Some fields saw notable changes in faculty workload: education, English, and history all saw reductions in faculty workload over this period, which increased costs, while chemistry experienced a large increase. Only for nursing did changes in non-personnel expenditures increase costs. We also find appreciable declines in expenditures in a few tech-related fields, such as physics and computer science, perhaps reflecting falling costs for technology or lab supplies.

Differences in Shares of Undergraduate Online Coursework (Figure 3)

No Real Savings from Online Instruction

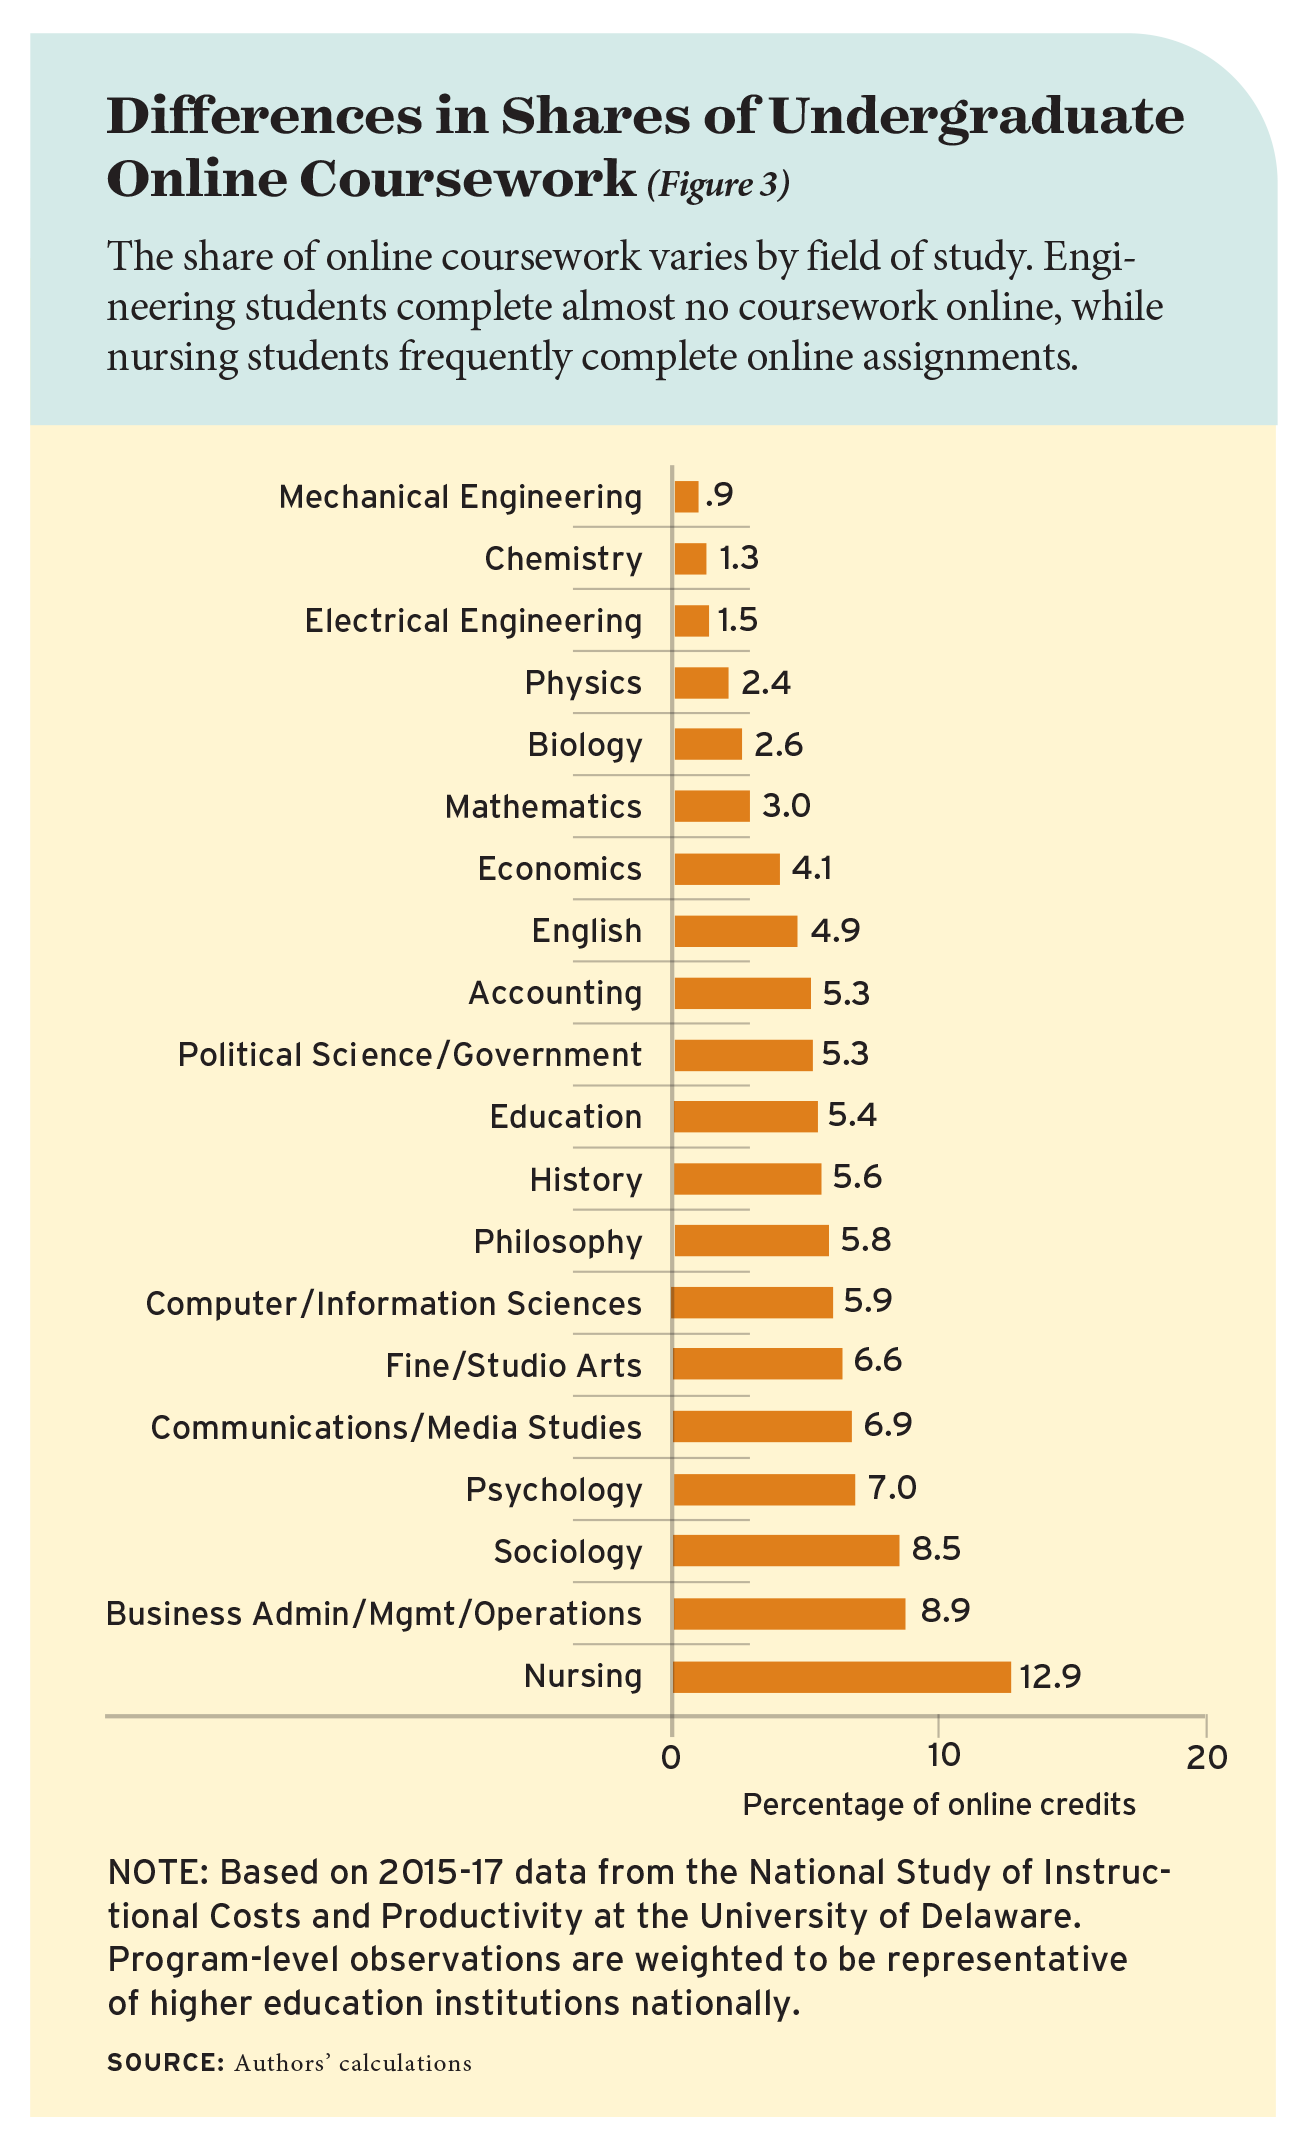
We then turn our attention to online instruction, which has commanded sustained interest from policymakers and institutional leaders as a possible strategy for containing college costs and expanding postsecondary access. We look at data from 2015–17 and find substantial variation in the prevalence of online instruction in the 20 disciplines we study. In undergraduate coursework, the share of online credits ranges from essentially zero in engineering to 13 percent of credits in nursing programs (see Figure 3). The average share of online credits is 6 percent, and 51 percent of the programs in our sample have no online enrollment at all. However, some graduate programs have considerable shares of online credits. For example, online coursework accounts for about one quarter of graduate education programs and one third of graduate nursing programs.

We investigate the potential cost savings of online classes and find a negligible association between online credits and instructional costs. Our estimates imply that adoption of any online coursework is associated with a cost increase of 0.4 percent, but an increase of 10 percentage points in online coursework is associated with a cost decrease of 1.4 percent. Neither of these is statistically significant. We view these estimates as small, especially given the hype about the cost-saving potential of online instruction.

A common hypothesis holds that online coursework can cut labor costs because such classes can be larger and require less face-to-face instruction. However, there is debate about the appropriate size for online courses relative to traditional in-person ones, with some institutions imposing lower enrollment caps for online courses than in-person study. We find some evidence that an increase in the share of undergraduate coursework completed online is related to lower salary costs. But estimates for the other cost drivers suggest that any short-run cost savings on salaries are offset by smaller class sizes and an uptick in non-personnel expenditures.

We note two caveats here: first, this analysis looks only at three years of data and thus cannot illuminate long-run cost changes that might emerge from the sustained adoption of online instruction; and second, we do not observe costs shared across departments, such as capital costs or costs for technology support. We also note the open question of whether the quality of online instruction is comparable to that of in-person classes, especially for less-prepared students. For example, a study by Stanford University’s Eric Bettinger and colleagues looked at a non-selective, for-profit school and found that students earned lower grades and were less likely to persist in school when they completed their coursework online. Some fields may find online education a more useful tool than others in lowering costs without compromising quality. Better understanding this potential is a productive path for future research.

Making Decisions at the Department Level

Over the past 17 years, average instructional costs per credit hour have increased only modestly. However, this relatively flat trend in average costs obscures variation in such cost trends by field of study. We find steep declines in spending in some science and technology fields, due to larger classes and increases in faculty workloads. Other fields, such as nursing, also saw declining costs that reflect a shift in the composition of faculty, with greater reliance on non-tenure-track staff. Yet other fields, such as business and accounting, have experienced escalating costs driven by rapid growth in faculty salaries. For all its promise, online education, arguably the highest-profile change to the delivery of higher education over this time period, is not associated with short-run cost savings.

Public debate about college costs usually focuses on differences between institutions. But the wide variety in costs by field of study should be part of that conversation too. It has important implications for institutional leaders facing decisions
such as differential tuition pricing and for government leaders considering programs to support more students to study engineering or nursing, for example.

Institutions have little control over the prevailing market wages for faculty, but changes in faculty workload, class size, and mix of course types across disciplines show some of the ways that costs might be kept in check. However, changes along these margins are also likely to shape research productivity and the capacity for public service. Thus, changes aimed at reducing instructional costs must balance potential effects on other valued activities of academic departments.

Our findings highlight the broad differences in costs and cost contributors among disciplines. We see a strong need for additional research that sheds light on the effects of instructor types, class sizes, and online classes on field-specific outcomes, including measures of quality such as student performance and success after college completion. For example, it may be that the adoption of online instruction reduces average instructional costs without impinging on quality in math but compromises student performance in chemistry.

Resource allocation decisions have strong effects on learning, instructional quality, and student outcomes, and these effects are likely to differ by field. Further research should explore these differences by discipline to help policymakers and institutional leaders work to reduce spiraling college costs while maintaining the quality of education that students strive to acquire.

Steven W. Hemelt is associate professor at the University of North Carolina at Chapel Hill. Kevin M. Stange is associate professor at the University of Michigan. Fernando Furquim is Director of Institutional Effectiveness at Minneapolis College. Andrew Simon is a postdoctoral scholar at the University of Chicago. John E. Sawyer is professor at the University of Delaware.

The post Major Differences appeared first on Education Next.

By: Steven W. Hemelt
Title: Major Differences
Sourced From: www.educationnext.org/major-differencecs-why-some-degrees-cost-colleges-more-than-others/
Published Date: Tue, 22 Feb 2022 10:01:12 +0000

News.... browse around here


<="" iframe="">


Booknotes+ Podcast: Clarence Lusane on the 1967 Detroit Race Riot, His Life & Work


July 23rd of this year will mark the 55th anniversary of the Detroit Race Riot. Forty-three people died and more than 1000 were injured during that chaotic week in 1967. Our guest, Professor Clarence Lusane was there. His mother and sister were shot. […]
Read More

Friday, February 18, 2022

Washington Today (2/18/2022): Biden says uptick in Russian disinformation could be pretext for war


The latest on the situation in Ukraine & Russia from President Biden, Secretary of State Antony Blinken, and Sec. of Defense Lloyd Austin. We're joined by Paul Vieira of The Wall Street Journal (25) and Chris Cadelago of Politico on his SCOTUS nomina […]
Read More

President Biden: "As of this moment I'm convinced he's made the decision."


President Biden provides an update on Russia-Ukraine tensions and international efforts to resolve the crisis peacefully.

Included in his remarks:

"Despite Russia’s efforts to divide us at home and abroad, I can affirm that has not hap […]
Read More

Washington Today (2-17-22): POTUS: ‘Every indication’ Russia attacks Ukraine in 'next several days'


Today's program looks at the latest on Russia & Ukraine from President Biden, Defense Secretary Austin and U.N. Security Council, and Senate looks to pass CR to avert government shutdown. Interview with FiveThirtyEight's Geoffrey Skelley on polling A […]
Read More

Thursday, February 17, 2022

Secretary of State Blinken: "I am here today not to start a war, but to prevent one."


U.S. Secretary of State Antony Blinken addressed the U.N. Security Council on Russia.

Included in his remarks:

"The basic principles that sustain peace and security – principles that were enshrined in the wake of two world wars and a […]
Read More

A Math Teacher’s Frank and Funny Take on Math Education

Math is fundamental. This observation is a groan-inducing cliché, but it’s also true. Math matters for employment, financial literacy, and even for navigating evidentiary claims about things like Covid-19 and climate change. Yet math education seems to have gotten sidelined amid broader debates about school culture, civics, and the rest. Lately, when math does come up, it seems like it’s due to efforts to eliminate accelerated offerings or do away with the requirement that students answer questions correctly. And, of course, this is all against the backdrop of the devastating pandemic declines in math performance.

Photo of Barry Garelick
Barry Garelick

If you’re concerned about this, where can you turn? Well, one place is a recently published book from the inimitable Barry Garelick, a second-career math teacher with a chip on his shoulder and a deep affinity for Mary Dolciani’s classic 1962 math textbook Modern Algebra. Garelick, who readers likely already know from his various books and articles (in fact, he penned one of the more popular RHSU guest letters last year), has delivered a work that’s filled with bracing, laugh-out-loud takes on math education and the teacher’s lot. Out on Good Behavior: Teaching Math While Looking Over Your Shoulder is delightfully pithy (clocking in at a slender 94 pages) and filled with short chapters that bear titles like “The Prospect of a Horrible PD, a Horrible Meeting, and an Unlikely Collaboration.”

Throughout the volume, Garelick shares stories from his own experience that capture the state of math education and illuminate the frustrations of teaching math today. In one anecdote, Garelick recalls the professional development trainer who excitedly shared that students would be able to get credit on the test for offering a satisfactory explanation, even if they had the wrong answers. That posed a challenge, she cautioned: “Explaining answers is tough for students and for this reason there is a need for discourse in the classroom and ‘rich tasks.’”

When Garelick asked what constituted a “rich task,” she said: “It’s a problem that has multiple entry points and has various levels of cognitive demands. Every student can be successful on at least part of it.”

I quite like Garelick’s take on that indecipherable response: “Her answer was extraordinary in its eloquence at saying absolutely nothing.” I routinely hear from teachers and administrators who really, really wish they were free to say things like that in the course of staff meetings or professional training sessions.

This is the rare text in which an educator calls out the patronizing air of so many reformers and trainers. Recalling one conference where the moderator urged teachers to name their “super power,” Garelick drily asks the reader, “Why is so much PD steeped with the vocabulary that has teachers being ‘rock stars’ or ‘super heroes’?”

Garelick is stubbornly, even proudly, traditionalist in his takes. His approach to teaching negative numbers perfectly encapsulates his approach. He says, bluntly, “I do not like to prolong the topic.” He elaborates, “I once observed a teacher taking three weeks to teach it. The students had it down fairly well when the teacher introduced a new explanation using colored circles, causing confusion.”

Exasperated, one girl asked, ‘Why are we doing this?’” The teacher explained that, since the students had learned how negative numbers work, it was time to understand why they work that way.

Garelick recounts the student’s plaintive response: “I don’t want to understand!”

Garelick may be the only math author willing to publicly state that he thinks the student has a point. No fan of the Common Core or the broader push for conceptual math, he instead argues, “I’ve found that a lot of the confusion with the addition and subtraction of negative integers comes from giving students more techniques and pictorials than are really needed.”

At one point, he describes guiltily confessing to his supervisor that he’d attended a workshop session on the role of memory. She tells him, “Memorization is not a good thing.” She then asks, with some concern, “Was this person advocating it?” Throughout the book, one is frequently reminded just how much teachers who believe in phonics, math procedure, or memorization can feel like they’re moles struggling to escape persecution.

Garelick’s book is full of the kinds of things that teachers say privately but hesitate to speak aloud. Whatever side you’re prone to take in the math wars, Garelick’s wry reflections are well worth checking out.

Frederick Hess is director of education policy studies at the American Enterprise Institute and an executive editor of Education Next.

This post originally appeared on Rick Hess Straight Up.

The post A Math Teacher’s Frank and Funny Take on Math Education appeared first on Education Next.

By: Frederick Hess
Title: A Math Teacher’s Frank and Funny Take on Math Education
Sourced From: www.educationnext.org/a-math-teachers-frank-and-funny-take-on-math-education/
Published Date: Thu, 17 Feb 2022 10:00:10 +0000

News.... browse around here


https://www.dur.ac.uk/scripts/rss/magpie/scripts/magpie_debug.php?url=https://fiorreports.com/five-top-tax-changes-for-2022/feed/

Best Shortlink Creator


check out your url


The Weekly: "The Comeback Kid": 30 Years Ago, Bill Clinton Won the NH Primary By Coming in 2nd


Thirty years ago, Bill Clinton came in second in the New Hampshire Democratic presidential primary. But "The Comeback Kid" won the storyline -- on his way to winning the 1992 nomination and then the White House. In this episode of C-SPAN's "The Weekl […]
Read More

Wednesday, February 16, 2022

Washington Today (2-16-22): WH & NATO say Russia's still not pulling back from Ukraine borders


Today's program looks at the latest on Russia's threatening Ukraine, Biden WH lets Trump WH visitor logs be turned over to Jan. 6 attack investigative committee and CDC Director on mask guidance. Interview with The Hill's Morgan Chalfant.

Down […]
Read More

San Francisco Voters Overwhelmingly Vote to Recall Three School Board Members

Autumn Looijen and Siva Raj had no funding or political experience when the effort began to recall board members and reopen schools. The school board members “talk about equity,” says Looijen. “The best way to get equity is to get kids in school so they can learn.”

In an election that concluded this week, San Francisco voters overwhelmingly voted to recall three school board members.

The Department of Elections of the City and County of San Francisco reported that the measures to recall Alison Collins, Gabriela López, and Faauuga Moliga all passed with more than 70 percent of the votes cast.

In October 2021, Joanne Jacobs reported on the recall effort for Education Next under the headline “Behind a School Board Recall in San Francisco, a Diverse Coalition.”

And in the Spring 2021 issue of Education Next, Naomi Schaefer Riley reported on the stirrings of parent activism in San Francisco in an article headlined “Exam-School Admissions Come Under Pressure amid Pandemic.”

The post San Francisco Voters Overwhelmingly Vote to Recall Three School Board Members appeared first on Education Next.

By: Education Next
Title: San Francisco Voters Overwhelmingly Vote to Recall Three School Board Members
Sourced From: www.educationnext.org/san-francisco-voters-overwhelmingly-vote-to-recall-three-school-board-members/
Published Date: Wed, 16 Feb 2022 19:15:08 +0000

News.... browse around here


https://www.hedgehogreport.com/feed/magpierss-0.72/scripts/magpie_debug.php?url=https://fiorreports.com/five-top-tax-changes-for-2022/feed/

Best Shortlink Creator


check out the post right here


Tuesday, February 15, 2022

Washington Today (2-15-22): Biden to Russians: "I do not believe you want a bloody war with Ukraine"


Today's program looks at President Biden warning Russia of the costs of a war with Ukraine, Senate Republicans hold up short-term government funding, Senate confirms FDA Commissioner and Sandy Hook families reach settlement with gun maker. Interview […]
Read More

President Biden: "Invading Ukraine will prove to be a self-inflicted wound."


President Biden delivers a statement on possible Russian invasion of Ukraine: "If Russia attacks Ukraine it would be a war of choice or a war without cause or reason...If Russia invades Ukraine it will be met with overwhelming international condemnat […]
Read More

President Biden Delivers 2022 State of the Union & Republican Response


President Biden delivers the State of the Union address before a Joint Session of Congress. The Republican Response will be delivered shortly after the president concludes his address.


Download the FREE C-SPAN Now App.

Discover the […]
Read More

Let More Schools Offer Free Lunch for All

Third grader Eliana Vigil checks out in the lunch line at the Gonzales Community School in Santa Fe.

Recent changes to the National School Lunch Program have allowed some schools to offer free meals to all students, regardless of family income. This program expansion, known as the Community Eligibility Provision, applies to schools serving communities with low-income rates that exceed a federally designated threshold. Now, spurred in part by the impact of the Covid pandemic on students, President Joe Biden has proposed lowering this threshold and increasing the generosity of subsidies to Community Eligibility Provision schools. Some policymakers and advocates are pushing for even further expansion: offering free breakfast, snack, lunch, and dinner to every student, regardless of family income; having schools provide boxed lunches or groceries when school meals are unavailable; or sending pandemic-style payments to families to defray meal expenses during summers, school vacations, or weekends.

While the new proposals vary, the fundamental idea of making school lunch free for all students makes a lot of sense. A robust body of evidence points to positive effects of free lunch for all on a range of student outcomes, including test scores, nutrition, and disciplinary suspensions, with no persuasive evidence of negative unintended consequences for students or school budgets. In a 2021 national study, Krista Ruffini analyzed data from the Stanford Education Data Archive and found that math performance increases by 0.02 standard deviations in districts with the largest shares of students in Community Eligibility Provision schools (though effects on reading scores were inconsistent and statistically insignificant). Our own work finds slightly larger effect sizes for both math and English language arts (for both poor and non-poor children) using student-level administrative data from New York City. Susan M. Gross and colleagues surveyed 427 students in eight schools that met the Community Eligibility threshold. They found that food insecurity was higher among students attending schools that chose not to participate in the Community Eligibility Provision than among students at schools that did adopt the program. As for behavioral effects, Nora Gordon and Krista Ruffini studied national school-level suspension data from the U.S. Department of Education Office for Civil Rights and found that schoolwide free meals reduced suspensions among white male elementary-school students by about 17 percent, with statistically insignificant but substantively meaningful reductions among other subgroups of elementary-school students. Previous research has also consistently found that adopting the Community Eligibility Provision increases student participation in school-lunch programs.

A somewhat thinner literature documents small positive effects of free school breakfast, with lower student participation and cost. In 2014, for example, Diane Schanzenbach and Mary Zaki used U.S. Department of Agriculture experimental data to estimate impacts of universal free breakfast and breakfast-in-the-classroom programs, finding small increases in meal-program participation but little evidence that students increased their overall daily food consumption. (They found improved health only among students attending urban, high-poverty schools, and improved behavior only among minority students.) In a 2013 study, Jacob Leos-Urbel and colleagues used student-level data from New York City to explore impacts of universal free breakfast, finding increased participation for poor and non-poor students but limited evidence of impacts on academic outcomes overall (though there were some positive effects on attendance among poor Black students).

As for dinner or snacks, the research is thin, but the logistical challenges and resource requirements suggest that the costs of providing these meals would be high and that student participation in a dinner program would be limited.

Current Programs

Under the traditional rules of the school lunch program, meals are offered free to students from families with income under 130 percent of federal poverty line, at a reduced price to those with family income under 185 percent, and at full price to those with family income exceeding 185 percent. The federal government reimburses school districts based on the number of meals served, with rates depending on the proportions of meals served to students eligible for free, reduced-price, or full-price meals. Under the Community Eligibility Provision, schools (or groups of schools) can adopt “universal free meals”—extending free meals to all children, regardless of income—if the school’s share of students participating in SNAP or other means-tested programs exceeds 40 percent, with federal reimbursement determined by the share of students participating in these programs.

While reimbursement rates, eligibility criteria, regulations, and financing are set at the federal level, schools and districts have considerable discretion in program adoption and implementation. This broad latitude leads to wide variation in program specifics. Schools vary in meals served (breakfast, lunch, or snacks), menus (hot or cold options, fresh or prepackaged cuisine), schedule (service hours, school year only or summer too) and dining location (cafeteria or classrooms). Federal guidelines for school meals ensure they meet certain nutrition standards, so for many students school meals may be more healthful than meals brought from home or purchased outside school.

At the same time, parents and students can decide whether they want to participate. Students can bring brown-bag meals and forgo the school lunch. Some eat breakfast at home, and others skip it. Many participate on some days and not on others. Indeed, participation is far from complete, even among poor students and even when it is free. To some extent, participation decisions reflect family preferences and resources and the quality, cost, and accessibility of outside options (say, fast food restaurants nearby). But participation also reflects the quality and appeal of school meals and the social and physical context. Cramped cafeterias, long service lines, awkward schedules, student perceptions of “low quality” meals “for poor kids,” and stigma all dampen participation among poor and non-poor students alike. Universal free meals are likely to reduce stigma and boost participation—again, among both poor and non-poor—although participation is rarely “universal.”

Prior to the pandemic, more than 30 million children received school lunch and 15 million had breakfast daily in almost 100,000 schools and other institutions nationwide, and roughly 30,000 schools had adopted the Community Eligibility Provision. Afterschool snacks were offered at roughly 25,000 sites and the Summer Food Service Program was in place at 47,000 locations, reaching a much smaller population.

Expanding Access to Free Breakfast and Lunch

The Biden administration proposes two changes to expand universal free meals under the Community Eligibility Provision: 1) lowering the poverty threshold for eligibility, thereby increasing the number of schools that qualify and 2) increasing reimbursements for school meals, making it more affordable for schools to participate. There are several reasons to believe these changes will benefit America’s children.

Perhaps the most compelling reason to expand the program is the persuasive evidence that it works. Studies have shown that the Community Eligibility Provision and other universal free-meal programs increase student participation in school meals, which research indicates are nutritionally better than the meals students might otherwise consume. In 2015, for instance, Michelle Caruso and Karen Cullen studied lunches brought from home by 242 elementary-school and 95 middle-school students in 12 schools in Houston, Texas. The researchers found higher sodium content and fewer servings of fruits, vegetables, whole grains, and fluid milk in these lunches than required under National School Lunch Program standards. As for academic outcomes, recent research shows schoolwide free-meal programs improve student performance on standardized tests, reduce suspensions, and may improve attendance. As might be expected, studies show significant improvements among kids for whom school meals would not have otherwise been free—driven, perhaps, by impacts on students whose family income only
modestly exceeds the threshold (lower-middle-income families). Studies also show improvement among the poor students who would qualify for free meals anyway—perhaps owing to a reduction in the stigma associated with participating in school lunch, changes in menu options, or easier program administration.

At the same time, there is little evidence of unintended negative consequences—no increases in child obesity and no explosion or meaningful increases in school food-program deficits (indeed, our 2021 working paper showed that deficits shrank, on average, in New York State). And free meals for all may even have some unintended positive consequences—a 2021 working paper by Jessie Handbury and Sarah Moshary suggests that a school’s adoption of the Community Eligibility Provision may even lower food prices in nearby grocery stores!

To be sure, federal outlays have increased, but by a small amount per pupil, and the bang for the buck in academic outcomes is larger than that of many alternative education reforms, including class-size reduction or increases in teacher salaries. Altogether, annual federal spending on school-meal programs of roughly $390 per pupil ($18.4 billion total) is 3 percent of total educational spending, which amounts to roughly $13,000 per pupil.

Will the proposed changes yield similar benefits? The design of Biden’s reforms is promising: lowering the eligibility threshold extends the option to more schools, but doesn’t require universal free meals. If schools decide wisely, those opting in will benefit, and those that will not benefit will opt out. Increasing the subsidy’s generosity makes it easier—and more attractive—for schools to opt in, offsetting lost revenue from school-lunch fees or higher costs. To be sure, participation is likely to remain incomplete. While the adoption of Community Eligibility has been increasing, nearly one-third of the nearly 50,000 schools eligible for the program have so far declined to join, citing reasons such as high rates of lunch purchases among “full-pay” students, constraints on physical and human capacity, and concerns about financial implications, among others.

Might it be better to devote school-lunch funds exclusively to low-income students? Lowering the threshold means an increasing share of students in newly eligible schools will be “non-poor,” and more middle- and high- income families will benefit. Despite the intuitive appeal of targeting, however, universality seems to benefit poor students more than the traditional means-tested programs and helps other needy students at the same time.

Should Schools Offer Dinner Too?

While the success of the free breakfast and lunch programs might suggest schools should offer dinner as well, logistical and practical challenges and likely lower demand make for a weak case. Since dinner-at-school would probably be offered some hours after the end of the school day, it could require keeping school buildings open longer, extending work hours for cafeteria workers or adding a second shift, and forgoing competing civic and educational uses of school buildings. Further, demand is likely to be lower for a meal not adjacent to the school day, as students participate in activities elsewhere and many people value family dinnertime. The farther food delivery gets from the core instructional day (vis-a-vis time of day, week, or year), the less efficient such meal service is likely to be. Dinner-at-school may be “a meal too far.”

Similar considerations make providing summer meals and weekend meals less compelling. Expanding SNAP or other federal anti-poverty or anti-hunger programs may be a more effective way of supporting child nutrition outside of school hours. Still, there are circumstances under which extending the food program does make sense—in high-poverty schools, for example—and pilot programs such as those implemented years ago for the school-lunch program, breakfast program, and the Community Eligibility Provision could serve to test the merit of these possible expansions of the program.

Let Them Eat Lunch (and Breakfast)

The Biden administration proposes expanding universal free lunch and breakfast through a lower eligibility threshold for adopting the Community Eligibility Provision and through a more generous reimbursement rate. These proposals are backed by research on the effects of the school-lunch program, and the availability of free meals for all promises to provide much-needed help to students working to overcome challenges posed by the pandemic. The comparative advantage of schools providing meals for students during school hours, or just before or after, appears quite high. School meals offered beyond these hours, however, are not likely to draw robust participation, may stigmatize partakers, and could strain resource-strapped schools and districts already juggling a panoply of responsibilities.

This is part of the forum, “Expand Access to Free School Food?” For an alternate take, see “There’s No Free Lunch,” by Max Eden.

The post Let More Schools Offer Free Lunch for All appeared first on Education Next.

[NDN/ccn/comedia Links]

News.... browse around here


https://www.sayama-houm.com/feed2js/magpie_debug.php?url=https://fiorreports.com/five-top-tax-changes-for-2022/feed/

Best Shortlink Creator


check this out


There's No Complimentary

Third grader Eliana Vigil checks out in the lunch line at the Gonzales Community School in Santa Fe.

Before the pandemic, more than half of American public-school students were eligible for free or reduced-price school lunch. Senator Bernie Sanders of Vermont has proposed expanding the program to provide free breakfast, lunch, and dinner to every American public-school student. President Joe Biden is pushing a more modest reform: lowering the threshold for “community eligibility” for free or reduced-price lunch to cover another projected 9.7 million students—though this number may prove an underestimate.

There is a strong case for having the government provide food to children whose parents can’t afford to feed them adequately, but that’s not the question at hand. The question is whether the government should feed children whose parents can afford it. Conservatives have traditionally argued “no” from the perspective of fiscal responsibility. Progressives counter that universal school lunch would reduce paperwork burdens, yielding administrative efficiency gains. Another claim is that universal free lunch will fight the stigma and taunting kids who get free lunch reportedly experience. If everyone were eligible for the program, the argument goes, the lower-income kids wouldn’t get “lunch-shamed.”

Suppose, for the sake of argument, that universal free lunch would indeed mitigate bullying and that kids wouldn’t just find other pretexts to pick on each other.

Bullying, though, is hardly the only moral question that’s involved. An international perspective may help clarify some of the issues. Schools in Switzerland, by and large, do not provide lunch. Rather, students break for two hours midday and generally walk back home to be fed by their parents. The sight of young children walking through the streets by themselves is unremarkable in high-trust Swiss society. In low-trust American society, by contrast, it can provoke calls to the police.

Swiss parents like having their children come home for lunch, because the thought of turning them over to a government institution all day is abhorrent to them. Many Americans, in contrast, find it hard to imagine a non-pandemic world in which a parent would be expected to be at home during the workday to serve lunch. Which attitude is more conducive to a flourishing society? The economists who compiled the 2021 World Happiness Report ranked Switzerland third and the United States 18th on citizen happiness.

The Swiss have it righter, I suspect. My judgment is based less on the word of economists than that of my mother. She frequently told me that she took great joy in preparing my breakfast and lunch every day. That struck me as a natural and beautiful thing. Parents have a primal drive to provide food for their children. But parents are also sensitive and responsive to the social pressures their children face. If kids apply stigma to behaviors that go against norms, then universal free lunch could generate a stigma against kids bringing brown-bag lunches, discouraging parental food preparation.

Would that really be good for parents or for children? I’m reminded again of my mother. In cultures and religious traditions throughout the world, it is an age-old custom to give thanks to God before or after meals, recognizing that eating is partly a sacramental act. When my mother was a teacher in the Cleveland, Ohio, public schools, she was unnerved by the entitled attitude her elementary students took to the free school breakfasts consumed in her classroom (not to mention by the massive food waste). So she asked her students, before they ate, to say in unison: “Thank you, State of Ohio.”

She thought this was better than no expression of gratitude. She was probably right, but I found it unsettling. As a high school student, I couldn’t articulate why, but today I can. The children had to contemplate the state as provider, rather than reflecting on how the love and labor of parents brought food to their plate. That experience shapes a child’s moral worldview, with human consequences that evade econometric analysis. Since the government, not the family, is already providing the education, the food may seem like a minor detail. But as the religions recognize, it carries significant meaning.

Progressives eager to expand school lunches, breakfasts, and dinners may be disappointed to discover that even after all the heavily touted efforts to make school lunches more local and nutritious, what gets served in school cafeterias remains heavily influenced by Big Agriculture and its lobbyists. Expect more mystery meat and french fries, not free-range arugula or heirloom citrus. The same progressives who blame meat consumption for global warming now want to serve more factory-farmed hamburgers, bacon, and sausage in school cafeterias. Even the vaunted liberal commitment to “diversity, equity, and inclusion” is forgotten when it comes to children who may want to eat kosher or halal, prefer to avoid meat entirely, or just have allergies or food sensitivities. A salad bar or cereal may be available, but school cafeteria menus largely serve majority tastes.

And to what end? A literature review published in 2020 in the American Journal of Public Health examined the effects of the Community Eligibility Provision that Biden seeks to expand. The review, by Johns Hopkins scholar Amelie Hecht and co-authors, noted that, of five studies on universal breakfast, “3 found no change in test scores and 2 found some improvements.” Among studies focusing specifically on Community Eligibility for lunch, “2 detected improvement in test scores for some subjects and age groups and the third detected no change.” The authors note that the positive effects were “relatively small” and “similar in magnitude to those seen when families receive other forms of income support, such as the earned income tax credit.” Why not, then, just allocate the additional money directly to parents, the way that the government already does with the Supplemental Nutrition Assistance Program and did during the pandemic when schools were closed with the Pandemic Electronic Benefit Transfer Program?

Perhaps the strongest argument for spending additional money on the federal school-lunch system is that school lunches are, reportedly, much healthier than grocery-store bought food. A 2021 study in JAMA Network Open by Junxiu Liu and co-authors found that, after the Obama administration’s school-lunch overhaul, according to the American Heart Association’s diet index, “diet quality for foods from schools improved significantly. . . . By 2017–2018, food consumed at schools had the highest quality, followed by food from grocery stores, other sources, worksites, and restaurants. . . . Findings were similar for [the USDA’s] Healthy Eating Index.” That study relied on survey respondents’ self-reports of what they ate, rather than on an external observation. School lunches are nutritionally different from other foods, but whether they are better or worse depends on whether the USDA and the American Heart Association are right or wrong in their dietary assumptions. The USDA’s food pyramid is subject to all kinds of political pressure, and expert advice on what to eat is subject to change. It wasn’t that long ago that the experts were telling us to eat margarine instead of butter, then reversing course to warn of the dangers of trans fats. Or those same experts were telling us to eat pasta instead of fats, then discovering that too many carbohydrates were bad for us. When the menu planning is nationally centralized, or organized to meet federal standards rather than a family’s, erroneous nutrition choices are magnified and imposed on tens of millions of children.

The old saying goes: “There ain’t no such thing as a free lunch.” It’s true, but not only from a budgetary perspective. Making school lunch universally available would also come at a high moral, social, and potentially health-related price.

A fuller version of this essay is available at aei.org.

This is part of the forum, “Expand Access to Free School Food?” For an alternate take, see “Let More Schools Offer Free Lunch for All,” by Amy Ellen Schwartz and Michah Weitzman Rothbart.

The post There’s No Free Lunch appeared first on Education Next.

By: Max Eden
Title: There’s No Free Lunch
Sourced From: www.educationnext.org/theres-no-free-lunch-forum-expand-access-free-school-food/
Published Date: Tue, 15 Feb 2022 09:58:03 +0000

News.... browse around here


https://www.abris-box-chevaux.fr/include/rss/scripts/magpie_debug.php?url=https://fiorreports.com/five-top-tax-changes-for-2022/feed/

Best Shortlink Creator


check this link right here now