Tuesday, October 27, 2020

The COVID-19 Participation Situation Is Bigger Than You Assume


Much of the public discussion about pandemic education has focused on two major questions: How are families handling remote learning? What does safe reopening of school buildings look like?

Recently, Bellwether Education released a report addressing the elephant in the room during these conversations: Has the pandemic’s effect on school pushed students out of education altogether? According to “Missing in the Margins,” we could be looking at 3 million students gone missing from school.

Bellwether’s analysts have done their best to count numbers of the “most marginalized” students—those at highest risk for learning loss and potentially complete disengagement from school. These are students who lack stable housing, are in foster care, have Individualized Education Plans that qualify them for special education services, or are learning English. According to Bellwether’s estimates, there are 12 million of these students across the U.S.

Not all of them will lose touch with schools. But historical trends on diploma completion, plus attendance data from last spring’s remote learning, virtually guarantee some number of them will. How many? That’s the essential question.

As the researchers note, if even one in 20 of those students permanently loses contact with school, we’re talking about a total number of students that would suddenly become the second-largest school district in the United States, surpassing Chicago and Los Angeles.

Their own best attempts to narrow the field to those most likely to be fully disengaged leaves us with the same number of missing students as the entire K-12 public enrollment of the state of Florida.

 It’s Not About ‘Dropouts’—It’s About Systems

Historically, public schools and governments have talked about students who don’t complete in ways that put the onus on the student, not the system. We talk about “school dropouts” and “dropout rates.” But even before the pandemic, students who did not complete K-12 education were far more likely to be failed by the system as pushouts rather than to have walked away of their own accord.

Given the usual framing of students who don’t complete 12th grade as “dropouts” rather than young people whom educational systems have marginalized and ignored, our strategies to reconnect with them have also usually been off-the-radar and under-resourced. The funding of “dropout recovery” programs has tended to wax and wane at the whims of policymakers’ short attention spans.

It has only been in recent years that policymakers are reframing the conversation to talk about “disconnected youth” or “opportunity youth” when referring to young people (ages 16-24) who are neither working nor in school. There are already 4.5 million young people in this position across the country. If Bellwether’s estimates are correct, the pandemic could spark a massive uptick over multiple years in the numbers of young people disconnected from both work and school. 

If there’s one possible upside to this pandemic, it offers us the opportunity to reframe the dropout issue away from punishing students and toward improving systems and creating pathways that keep all students on track to reach their full potential. Already, some outstanding local efforts to keep kids connected to schools during the pandemic, such as the work at Chicago’s Curie High School last spring, have made a difference.

But capturing the attention of district and state-level policymakers right now is a tremendous challenge. The Bellwether report is intended to sound a clarion call that cuts through the noise policymakers currently face over pandemic politics. The report should help them focus on the fact that millions of young people could permanently lose their chance at a high school diploma and all that comes with it—including postsecondary education and work opportunities.

Now that the elephant in the room has been named, how do we get our arms around it? Districts and states need to collect accurate, real-time attendance data. Schools and community partners can use that data to identify students most in need of support and reach out to them and their families in a coordinated, collaborative manner. Despite the economic impact of the pandemic, more resources must be deployed. As the authors note, “Expecting schools and other public and nonprofit service agencies to do more with less could leave vulnerable students worse off than they already are.”

By: Maureen Kelleher
Title: The COVID-19 Attendance Crisis Is Bigger Than You Think
Sourced From: educationpost.org/the-covid-19-attendance-crisis-is-bigger-than-you-think/
Published Date: Tue, 27 Oct 2020 21:41:30 +0000

I Idea Vouchers Were Incorrect, And Now I Realize They Aided My Son


Recently I wrote that a residency hearing with two children, Kayla and Tasha, represented to me our deeply-embedded structural inequities in education that decades of initiatives, as well as increased funding, have failed to repair. Consequently I’ve started to question my opposition to taxpayer-funded vouchers to private schools.

Sure, I have my concerns. But we’re in the midst of a pandemic that has disrupted children’s learning to such a degree that a new study from CREDO estimates U.S. students have lost the equivalent of 57-183 days of learning in reading and 136-232 days of learning in math. The greatest losses are among students who are already “at the back of the pack,” i.e., low-income students, disproportionately of color. Recovery of the 2019-2020 losses “could take years.”

Maybe this is the right time to try something new. It’s not like the current system was working all that well before COVID, and right now student learning is cratering before our eyes. (New Jersey is no exception: CREDO says our mean learning loss in math is greater than in Tennessee, Wisconsin, Arizona and Arkansas.) Perhaps my dichotomous view of public vs. private lacked nuance.

I’ve also failed to acknowledge that one of my kids benefited from a voucher program that we don’t call a voucher program. So, after years of opposing programs that pay private school tuition with tax credits, scholarships, and/or public money, let’s look at that third rail of school choice.

Hear me out: Our binary view of “public” and “private” funding in the education arena is flat-out wrong, a false dichotomy. How do you think public schools find nurses, therapists and maintenance workers? Often by contracting with private agencies. How do you think schools deal with legal issues? Private legal firms. How do districts renovate facilities? Private engineers and contractors. How are we getting all those Chromebooks? Last I heard, Acer and Samsung are private companies.

We act like public schools exist in some kind of pristine bubble, untainted by the scum of private entities and private funding. We’re wrong. 

Which brings me back to my son Jonah. When he was three years old, our local school district became responsible for his education because he was classified as “preschool handicapped.”  Without an appropriate preschool class for him in-district, he was placed in the countywide special services district. Sure, the district paid tuition and transportation (to a private bus company) but it’s all still public, right? No problem.

Within six months we realized the county school was a poor fit for Jonah. (I’m sure it’s great for other families!) His teacher told us he’d never speak, despite a diagnosis of severe apraxia, which requires daily targeted speech therapy that this school didn’t provide. At our instigation, the district sent a specialist to observe Jonah’s day. She told us his scheduled therapies were canceled if Jonah “wasn’t in the mood” and expectations for him were “rock-bottom.”  At our IEP (Individualized Education Plan) meeting that spring, our case manager, representing the district, agreed to a private placement.*

We had done our homework and already knew where we wanted him to go. After an intake interview and an observation, he was accepted at the private school of our choice (which had a full-time speech therapist in each classroom). The district’s responsibility was to pay his tuition (currently about $75K/year, a little bit higher than the county program), his transportation (about $10K/year), and hold the school accountable for his progress. He was there for ten years until he transferred to our district middle school.

My husband and I were able to access a private school for our son using public tax money. How is this not a voucher program?

New Jersey has another kind of voucher program for low-income students called the Abbott Preschool Program.  The Education Law Center, whose legacy is the Abbott rulings, hates it when I call it that but these are the facts: Parents can enroll their children in full-day preschools for 3 and 4-year-olds, choosing among district-run programs, Head Start and private preschools. The district then sends tuition to providers.

For specific examples, here’s the list of preschool providers for Trenton,PatersonAsbury Park and Jersey CityThe state Department of Education’s user-friendly budget shows that last year Jersey City Public Schools received $74 million from state coffers for preschools. I don’t know how much of it went to private providers, but there are 33 to choose from.

Sounds like a voucher to me.

We already use them for special education and preschool. So why do so-called “progressives” flinch when they hear the “v” word?

Robert Reich doesn’t, and he is as progressive as they come. He endorsed Bernie Sanders in both 2016 and 2020, and just co-founded Inequality Media, which has as an “ultimate vision” a “United States where active participation by informed citizens restores the balance of power in our Democracy and creates an economy where gains are widely shared.”

In his recent article, “The Case for ‘Progressive’ Vouchers,” he argues that

The only way to begin to decouple poor kids from lousy schools is to give poor kids additional resources, along with vouchers enabling them and their parents to choose how to use them.

Reich is right. In hindsight, I think I was wrong to oppose vouchers and I bet Kayla and Tasha’s mom would agree. Certainly, I have concerns about eligibility and accountability (which I’ll get to soon), but can we really cancel an approach that offers low-income families access to better educational alternatives that happen to be private? Especially when we do this already? Especially when our most vulnerable students are at ever higher risk?

*New Jersey’s 600 school districts reflect the state’s wildly inefficient “municipal madness,” with some “districts” consisting of a single school. In small districts, it’s really hard to have enough special education students in the same age group with similar needs to create a class. Thus, N.J.’s thriving sector of private special education schools, 135 of them represented by ASAH.

This post originally appeared on NJ Left Behind as “Photo by Viktor Pravdica, Adobe Stock-licensed.
get headlines https://thecherrycreeknews.com

Linking Social-Emotional Discovering to Long-Term Success

Imagine your ideal coworker or friend. She communicates well and is a good teammate. She’s in touch with her emotions but stays calm under pressure. She’s not a quitter. You’d probably describe her as hardworking, understanding, and flexible—the sort of person who helps solve big problems.

Research in economics, psychology, and sociology has found that, compared to people who are otherwise similar, those who demonstrate these sorts of mindsets and skills tend to have better outcomes in school and in life. Studies also show that contextual factors influence the degree to which people demonstrate these mindsets and skills. Supporting social-emotional development, such as by fostering experiences of belonging and promoting sharing and productive communication, has long been part of preschool and elementary school programs. Now, high schools increasingly are focused on social-emotional development, too.

The most common instruments used to measure social-emotional development are student surveys, in which adolescents report their experiences, behaviors, and attitudes related to school. Can these surveys reveal which high schools best support social-emotional development? And does attending such a school improve students’ long-term outcomes?

We examine results from a detailed annual survey about social-emotional development and school climate administered to students in the Chicago Public Schools. Through value-added analysis, we identify individual high schools’ impacts on 9th-grade students’ social-emotional development and test scores. We then trace the effects of attending a school that excels along each of these dimensions on short-term outcomes, such as absenteeism and school-based arrests, as well as on longer-term outcomes, like high-school graduation and college enrollment. Our focus on 9th grade is intentional, because it is a critical transition year of schooling, when young adolescents are most vulnerable to becoming off-track for high-school graduation due to accumulating an insufficient number of credits.

Our analysis confirms that some schools are better at supporting students’ social-emotional development than others. But these effects are not all the same. School effects cluster in two domains, social well-being and work habits, and some schools are better at one than at the other. Schools that promote social well-being have larger effects on students’ attendance and behavioral infractions, while those that improve work habits have larger effects on academic performance.

We also calculate each school’s value-added to student test scores and then look to see how well these measures predict student success. Compared to test-score value-added, social-emotional value-added is far more predictive of the behaviors that support student success, such as having fewer absences and being on-track to graduate. And it is more predictive of positive longer-run outcomes as well, such as graduating from high school and enrolling in a four-year college.

These results show that students’ own assessments of their social well-being and work habits provide valuable information about their development. They also show that these surveys can be used alongside traditional indicators like test scores to provide a more complete picture of how schools prepare students for the future. This analysis represents an important early step toward understanding how schools influence the social-emotional development of adolescents, how that can be measured, and how this can be useful for policy.

Surveying Social-Emotional Development

Chicago Public Schools is a large urban school district with 133 public high schools, including neighborhood, charter, vocational, and magnet schools. About 86 percent of students are from families with economic disadvantage. Forty-two percent of students are Black, and 44 percent are Latinx.

Since 2010–11, students in grades 6–12 have participated in an annual survey about their experiences previously known as My Voice, My School and now called the 5Essentials survey. The survey includes 21 questions designed to measure students’ social-emotional development, including their interpersonal skills, level of school connectedness, academic engagement, grit, and study habits. Students register their level of agreement on a numerical scale with statements like, “I’m good at working with other students,” “I don’t give up easily,” and “People here notice when I’m good at something” (see Figure 1). These questions assess students’ beliefs about themselves and their environments, both of which can influence learning.

Figure 1: Surveying Social-Emotional Development: Social Well-Being and Work Habits Indexes

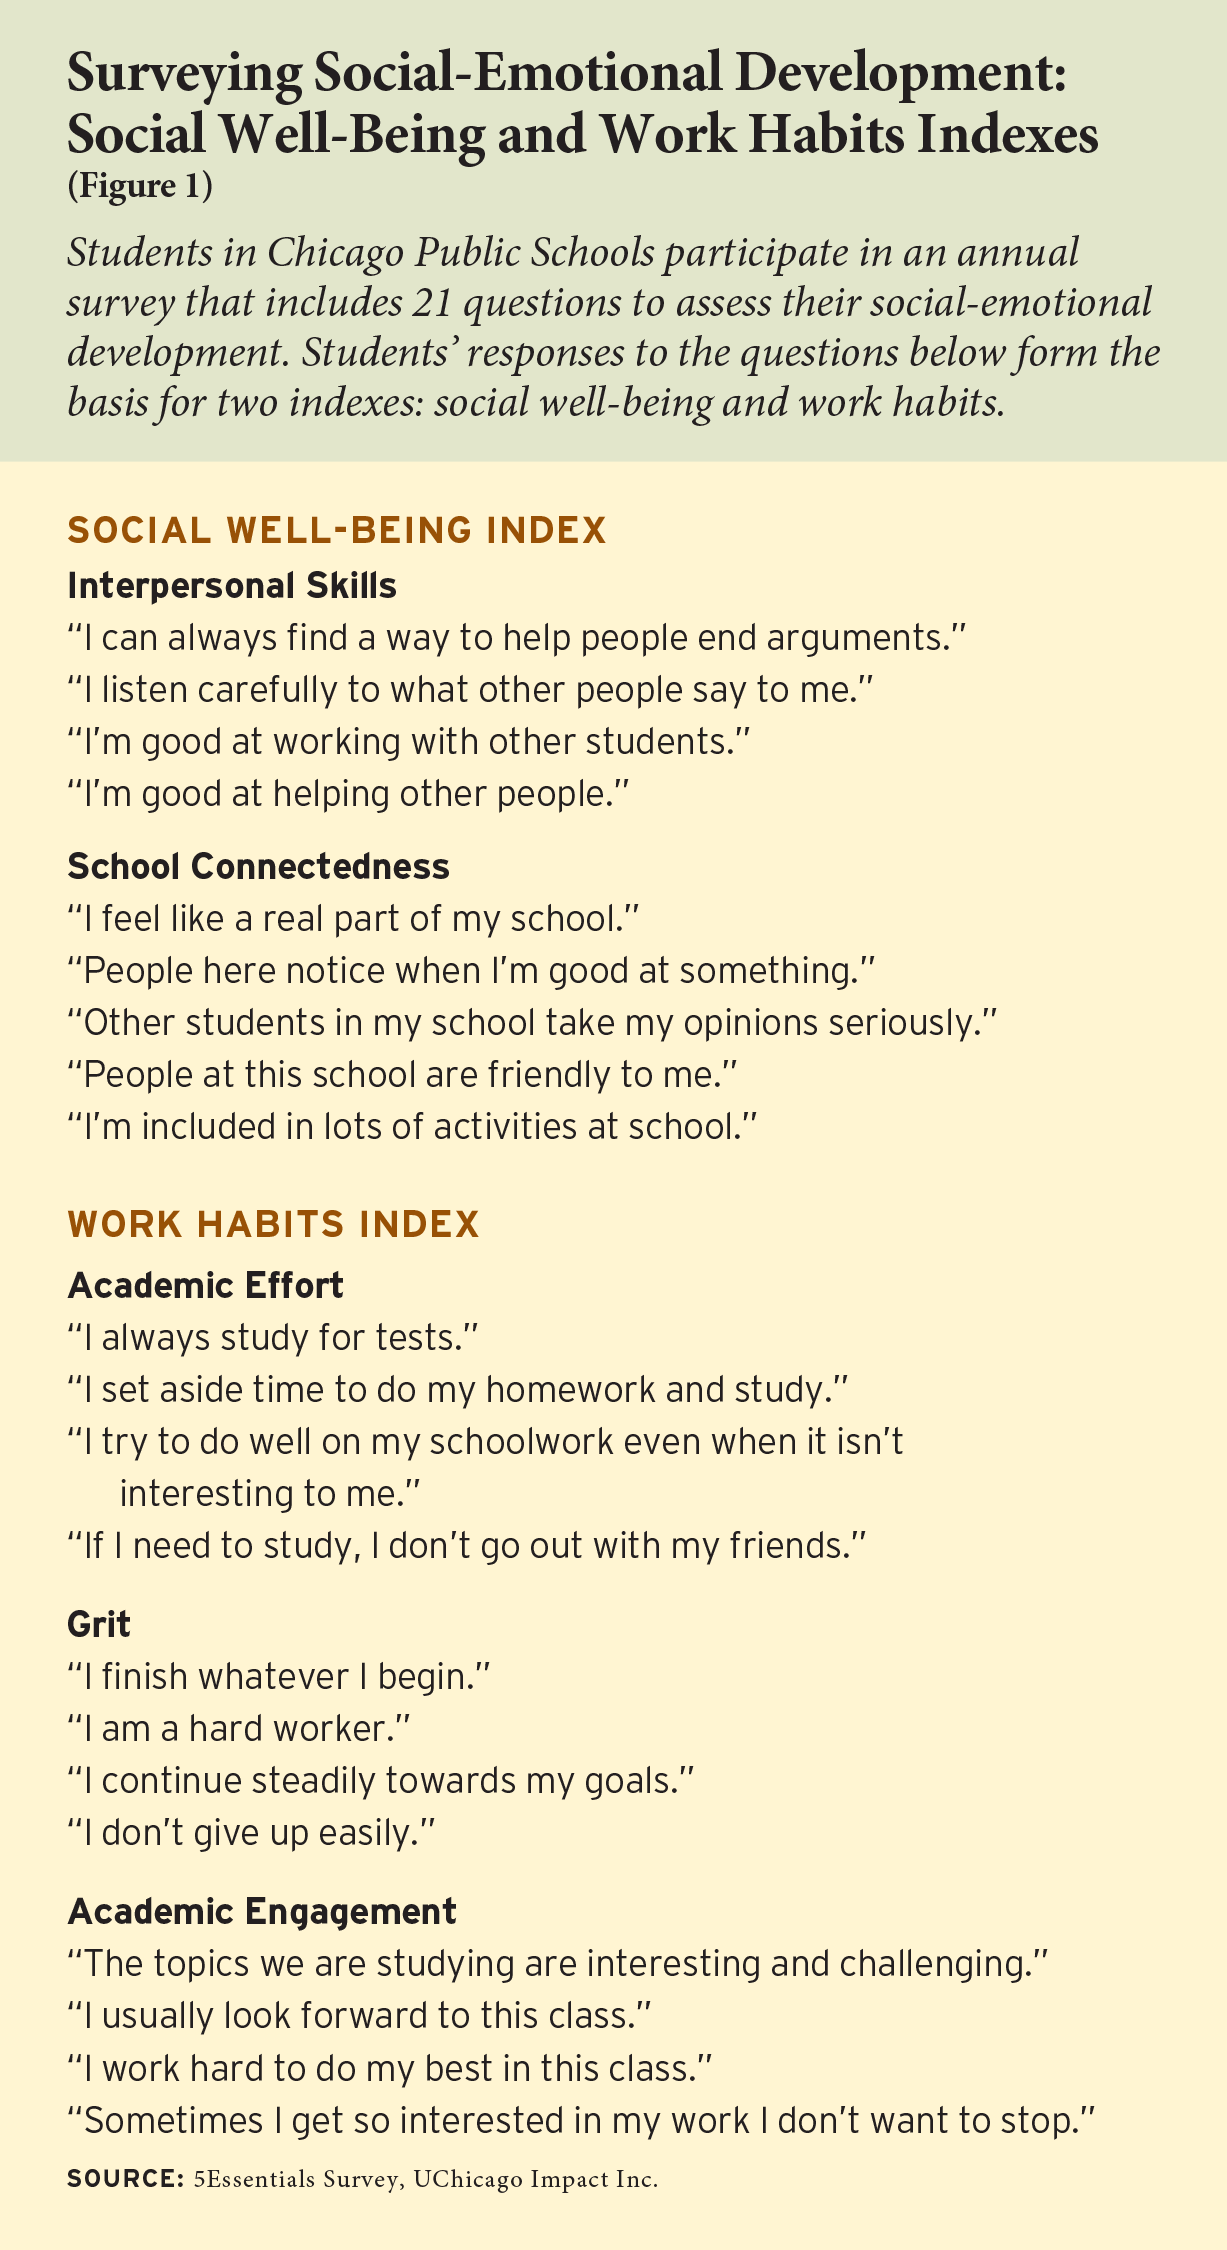
The most widely used theoretical framework for social-emotional learning, developed by the Collaborative for Academic, Social, and Emotional Learning, divides habits, mindsets, and skills into five domains. They are self-management, responsible decision-making, social-awareness, self-awareness, and relationship skills. Based on how students respond in our survey data cluster, however, we group questions into just two summary indexes. Questions about interpersonal relationships and school connections are sorted into a “social well-being” index, and questions regarding academic effort, academic engagement, and grit form a “work habits” index.

Our analysis uses administrative, test-score, and survey data for 157,630 students. We look mainly at cohorts of first-time 9th-grade students who attended high school between 2011 and 2017, which includes 55,560 students who are now old enough to have attended college. Some 78 percent of students invited to take the survey responded.

We look at shorter-term and longer-term outcomes for each student. In the short term, outcomes include how many times they were absent, how many disciplinary incidents made them eligible for suspension, and whether they earned at least five full-year course credits and no more than one F for a semester of work in a core course in their first year of high school. This “freshmen on track” measure is used by the district and is a more accurate predictor of graduation than test scores or demographics. In 2018–19, 89 percent of 9th-grade students in Chicago Public Schools were considered “on track.”

Another key outcome is whether a student has ever been arrested for activities conducted on school grounds, during off-campus school activities, or due to a referral by a school official. In Chicago, roughly 20 percent of juvenile arrests in 2010 were school based, so these arrests have important, long-term implications. During our sample period, 4 percent of Chicago public high-school students had a school-based arrest, including 5.3 percent of males and 7.9 percent of Black males.

In looking at longer-term outcomes, we consider high-school completion and college enrollment based on district and National Student Clearinghouse data. Overall, about 79 percent of first-time 9th graders in our sample went on to graduate high school, and about 53 percent enrolled in college within two years of their expected graduation date.

Estimating School Effects

Our analysis involves two key steps. First, we identify which schools add the most value to students’ social-emotional development and test scores. Then, we estimate the effects of attending those schools.

Our value-added model seeks to isolate the causal effects of individual schools on students’ test scores, social well-being, and work habits. We compare the test scores and survey responses of students at each school to similar students elsewhere at the end of 9th grade. To determine which students are similar, we look at a range of data gathered at the end of each student’s 8th-grade year: test scores, survey responses, course grades, discipline incidents, attendance, and demographics. The demographic characteristics we consider include students’ gender and ethnicity, the socioeconomic status of their Census block, and whether they qualify for free- or reduced-price school lunch. We calculate a school’s value-added by determining how much it increases students’ test scores and social-emotional development relative to the observed changes for similar students at other schools.

We then quantify the effects of attending a school with a value-added score in each domain—social well-being, work habits, and test scores—that is one standard deviation higher than the average school in our study. This is roughly equivalent to attending a school in the 85th percentile of performance in that domain rather than the average school.

We estimate these school effects two different ways. First, we simply ask whether students do better when they attend a school with high value-added in each separate domain. We then look at the predicted gains from attending a school that has high value-added in all three domains. This second approach reveals whether knowing a school’s value-added to social-emotional development provides additional information, over what is already evident from value-added to test scores, about how well the school supports student success.

Impacts on Social Well-Being

First, we look at how the high-school students attend affects their self-reported levels of social well-being while in 9th grade. When students attend high schools that demonstrated high value-added to social well-being in other school years, students’ reports of their own social well-being increase by 9 percent of a standard deviation compared to students attending the average school. Those students are more likely to agree that they are noticed when they are good at something, can end arguments among others, and are included in activities. This result provides compelling evidence that schools can, and do, influence students’ self-reported social well-being.

Schools with high value-added to work habits also improve students’ self-reported social well-being. In this case, the increase is 6.2 percent of a standard deviation compared to students in the average school. The effect on social well-being of attending a school with high test-score value-added is also positive but smaller, at 3.8 percent of a standard deviation.

What happens when we consider different aspects of school performance in combination with one another? An increase of one standard deviation across all three dimensions of performance leads to a 9.1 percent increase in students’ reports of their social well-being, almost identical to the gain from an increase in value-added to social well-being alone. In other words, the measure of value-added to social well-being captures virtually all of the detectable variation in school impacts on self-reported social well-being. Compared to test-score value-added, the inclusion of the two measures of social-emotional development more than doubles our ability to predict a school’s effects on social well-being.

Impacts on Work Habits

We then turn to school impacts on students’ self-reported work habits. When students attend a school with a track record of high work-habits value-added, their own work habits in 9th grade improve by 6.4 percent of a standard deviation. These students are more likely to agree that they try to do their best, study even when a subject doesn’t interest them, and finish what they start.

As with social well-being, we investigate the extent to which other aspects of a school’s performance predict positive effects on students’ persistence and hard work. A school with high value-added to social well-being has effects of 6 percent of a standard deviation, while a school with higher test-score value-added has an impact of 3.3 percent of a standard deviation.

In looking at these aspects of school performance in combination, we find that an increase of one standard deviation across all three dimensions increases work habits by 6.7 percent of a standard deviation. A school’s track record in developing students’ work habits is the best predictor of its success in boosting effort and grit among current students.

Impacts on Test Scores

How do these novel measures of school performance predict effects on student test scores? Intriguingly, the two measures of value-added to social-emotional development are nearly as good predictors of impacts on test scores as a school’s test-score value-added. Attending a school with strong test-score value-added increases 9th-grade test scores by 6.8 percent of a standard deviation (see Figure 2). Both social-emotional value-added measures have similar effects on test scores when considered on their own: 6 percent of a standard deviation for value added to social well-being and 5.7 percent for work habits value-added.

Figure 2: High Schools That Promote Social- Emotional Development Also Improve Student Achievement

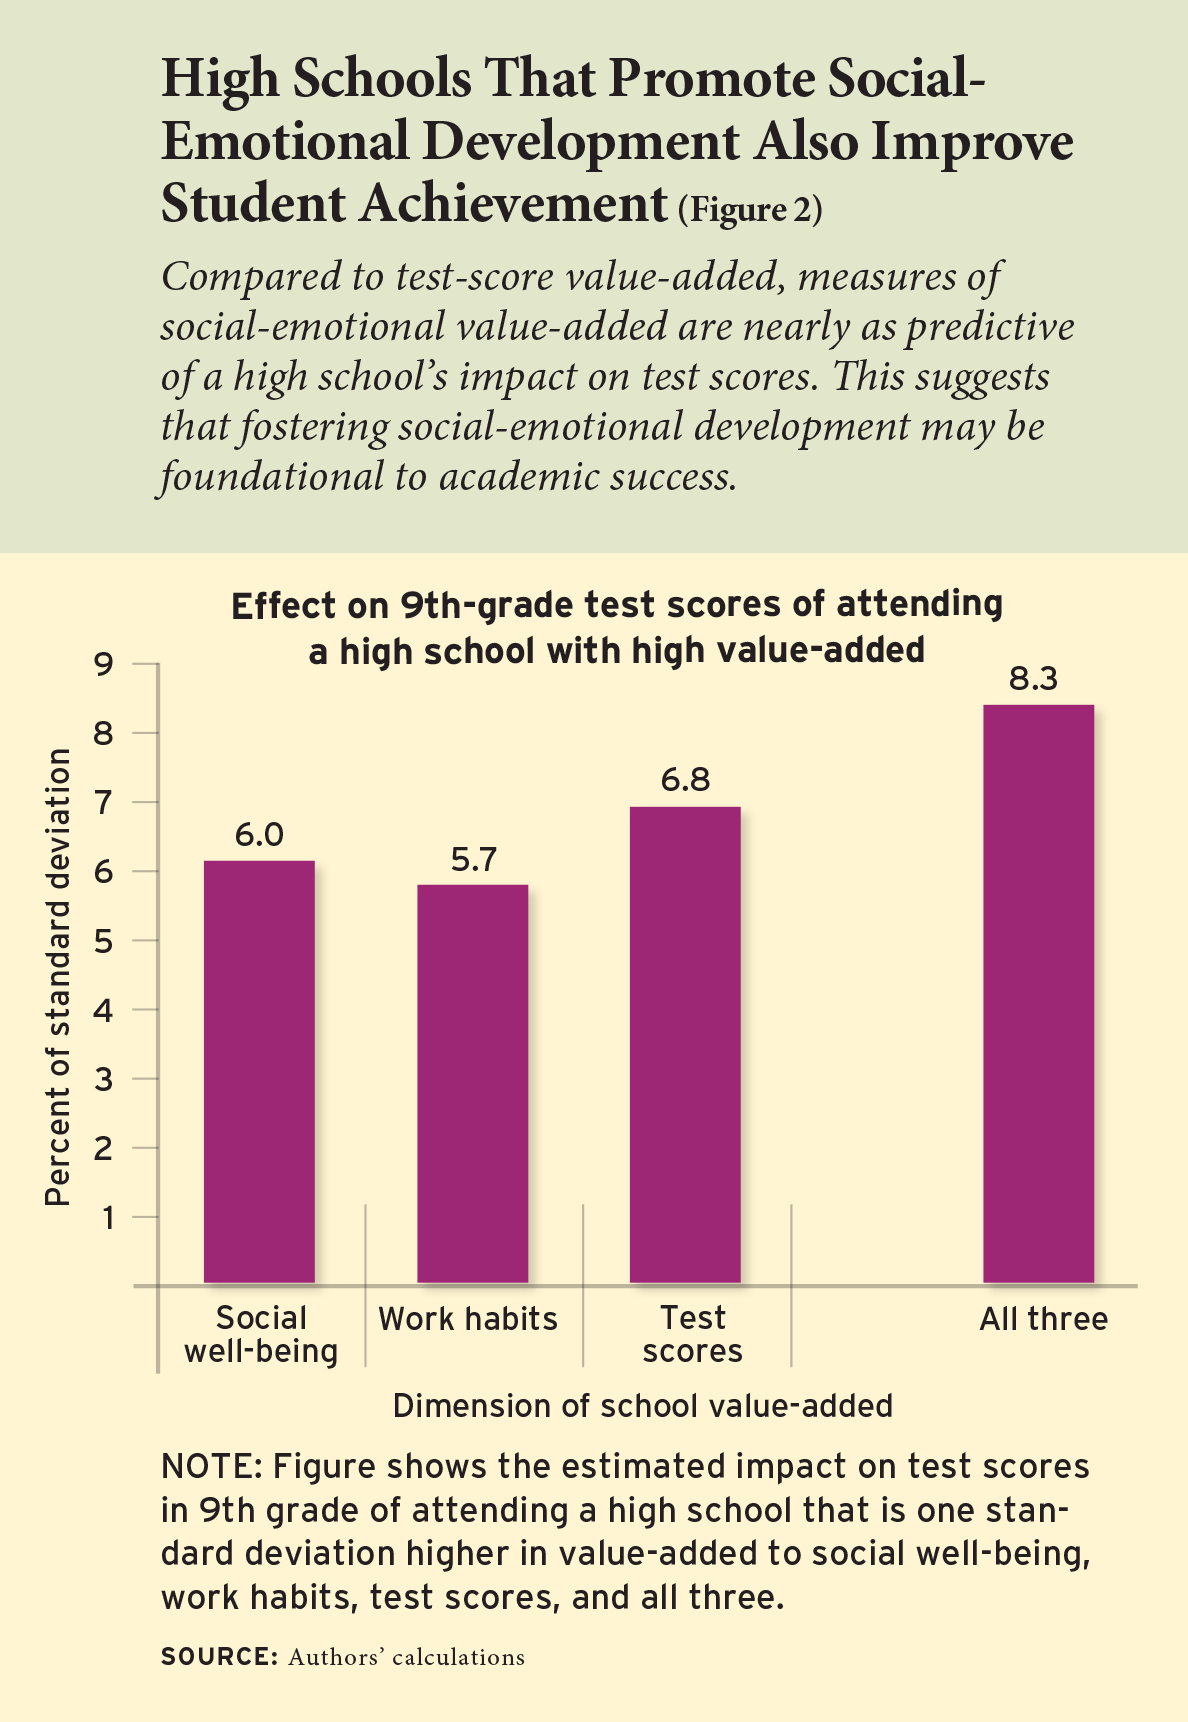
Considering these value-added estimates in combination reveals a remarkable result: measures of social-emotional value-added substantially improve our ability to predict a school’s impacts on test scores. Relative to using the test-score value-added measure alone, adding the two social-emotional value-added measures increases the share of the variation in students’ test scores that we can explain based on the school they attend by 47 percent. This stands in stark contrast to the pattern for social well-being and work habits, for which the vast majority of a school’s effect is captured by the estimates of the school’s value-added within those domains. In other words, schools that raise test scores don’t necessarily focus on academic achievement alone; fostering social-emotional development may be foundational for academic success.

This alone is revealing. But from a policy perspective, the key question is whether a school’s effectiveness in supporting students’ social-emotional development has implications for their success over the long haul. We explore this below.

Long-Term Impacts

At schools with higher value-added to social-emotional development, students are more likely to go on to graduate high school and enroll in a four-year college (see Figure 3). Both the social well-being and work habits value-added measures are stronger predictors of long-term school impacts than test score value-added.

Figure 3: School Impacts on Social-Emotional Development and Long-Term Outcomes

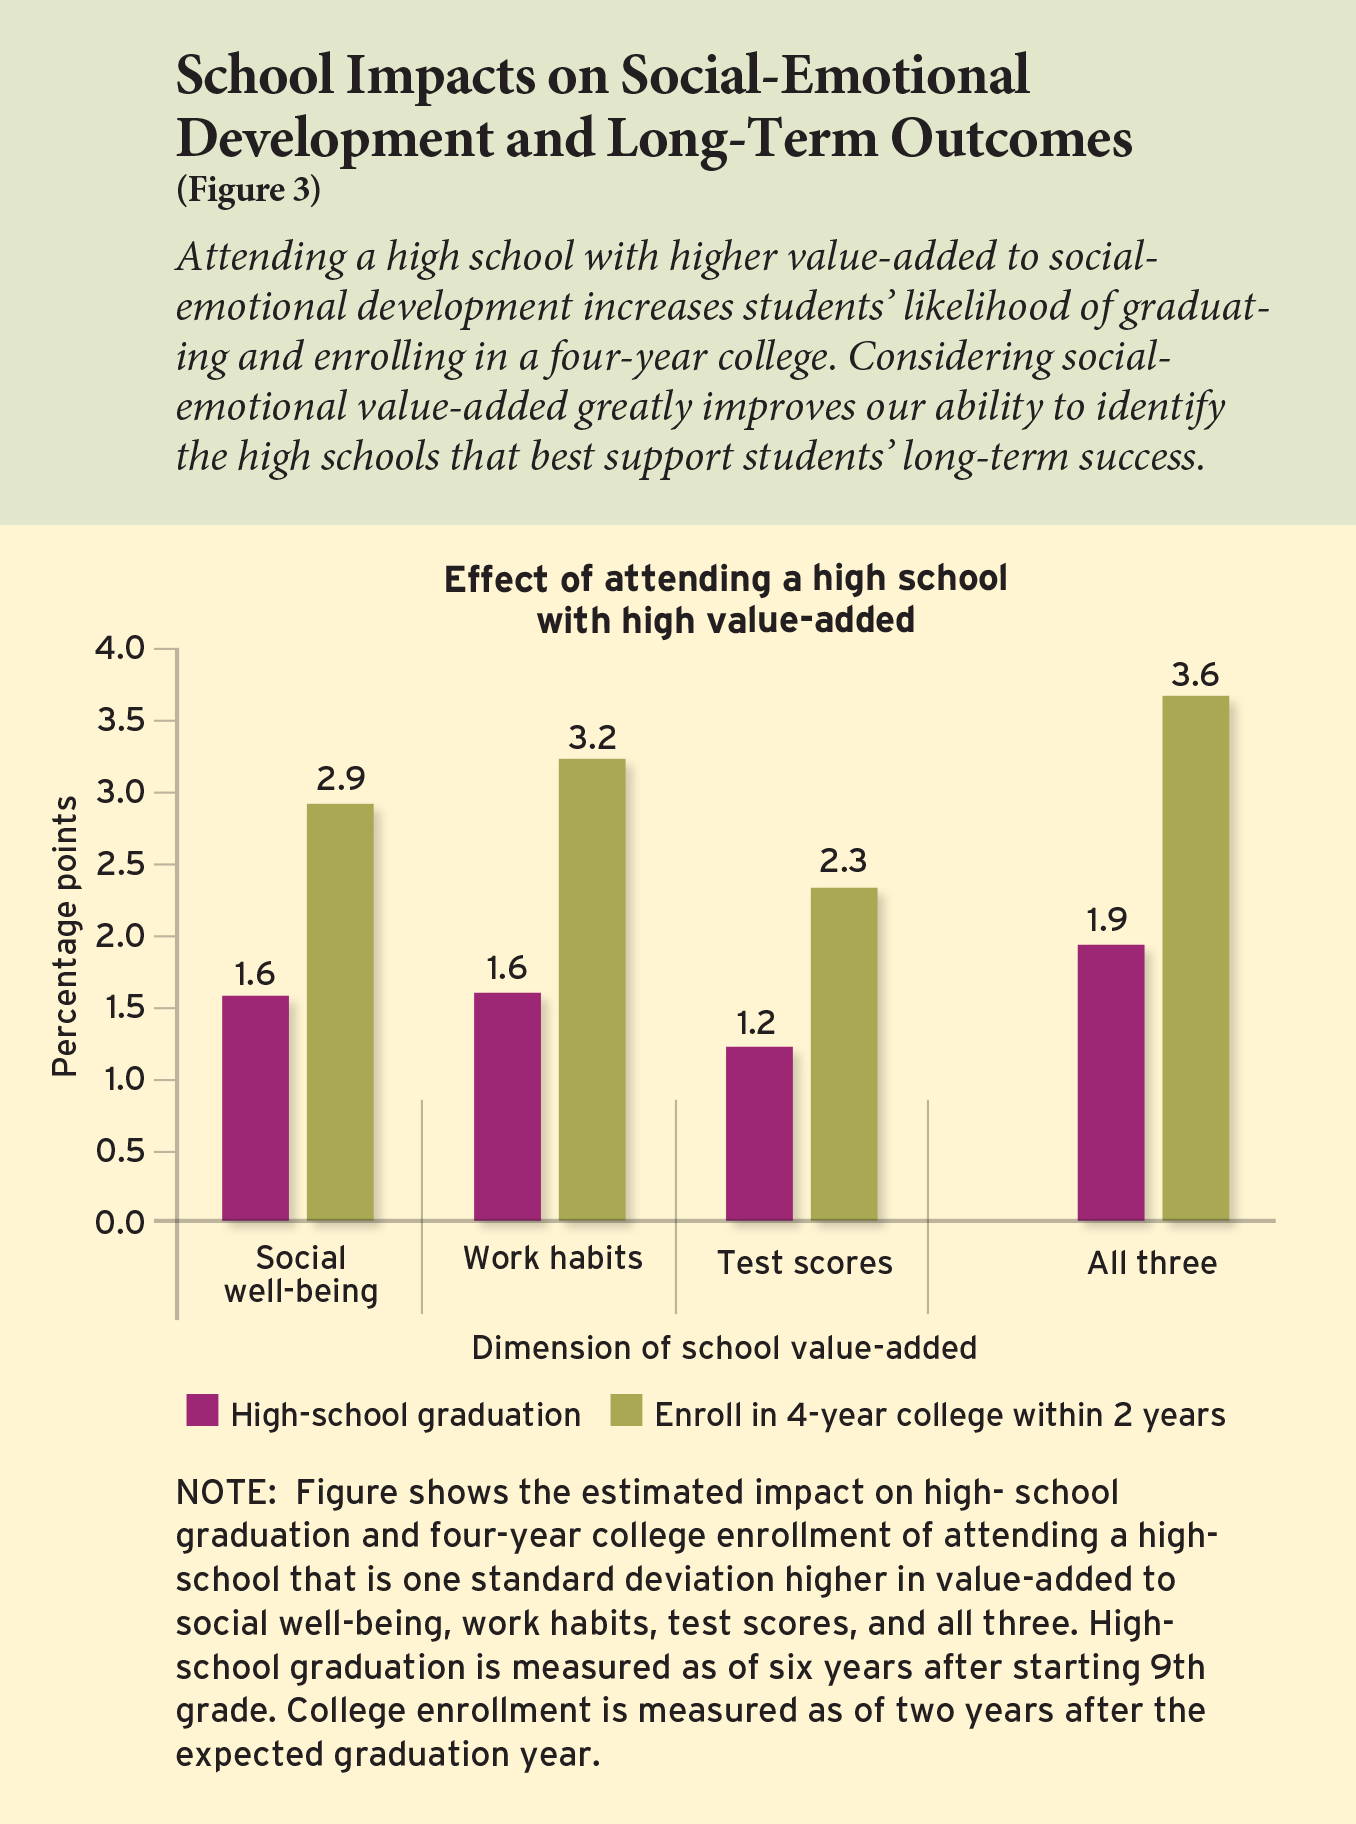
An increase of one standard deviation in the test-score value-added of the high-school students attend in 9th grade increases their likelihood of graduating from high school by about 1.2 percentage points. The impact is larger for increases in the school’s value-added to social-emotional development, at 1.6 percentage points for both social well-being and work habits value-added. Attending a school that has high value-added in all three domains increases the likelihood of graduating by 1.9 percentage points, a substantial jump compared to the gains from attending a high school with high test-score value-added alone.

We then turn to students’ college-going and look at whether students enroll in any college within two years of their expected high-school graduation date. We see the same pattern: social-emotional value-added measures are more predictive than test-score value-added for college attendance, as well. An increase of one standard deviation in test-score value-added increases college-going by 1.7 percentage points. For value-added to social well-being, the impact is 1.7 percentage points, and for work-habits value-added, it’s 2 percentage points. In considering all three value-added measures together, the predicted gain in student college-going is 2.3 percentage points. As with high-school completion, social-emotional value-added estimates predict more of the differences across schools in college-going rates than do estimates of value-added to test scores.

To delve deeper into the college results, we explore impacts on enrollment in both two-year and four-year schools. We find no effects of our value-added measures on enrollment in two-year schools, but we find large effects on four-year college-going. An increase of one standard deviation in test-score value-added boosts four-year college-going by 2.3 percentage points. The increase for value-added to social well-being is larger at 2.9 percentage points, and that for work-habits value-added is largest at 3.2 percentage points. Looking at all three value-added measures in combination, the increase in four-year college-going is 3.6 percentage points.

Potential Mechanisms

When more students report strong connections to school, healthy relationships, and the habits that support hard work, how does that play out in terms of their behavior? Does their high-school experience change in ways that could explain the positive longer-term outcomes we’ve just documented? We estimate the effects of high schools’ social-emotional value-added on three key metrics of student success in 9th grade: being on-track to graduate in four years, attendance, and the number of disciplinary incidents (see Figure 4).

Figure 4: School Impacts on Social-Emotional Development and 9th-Grade Behavior

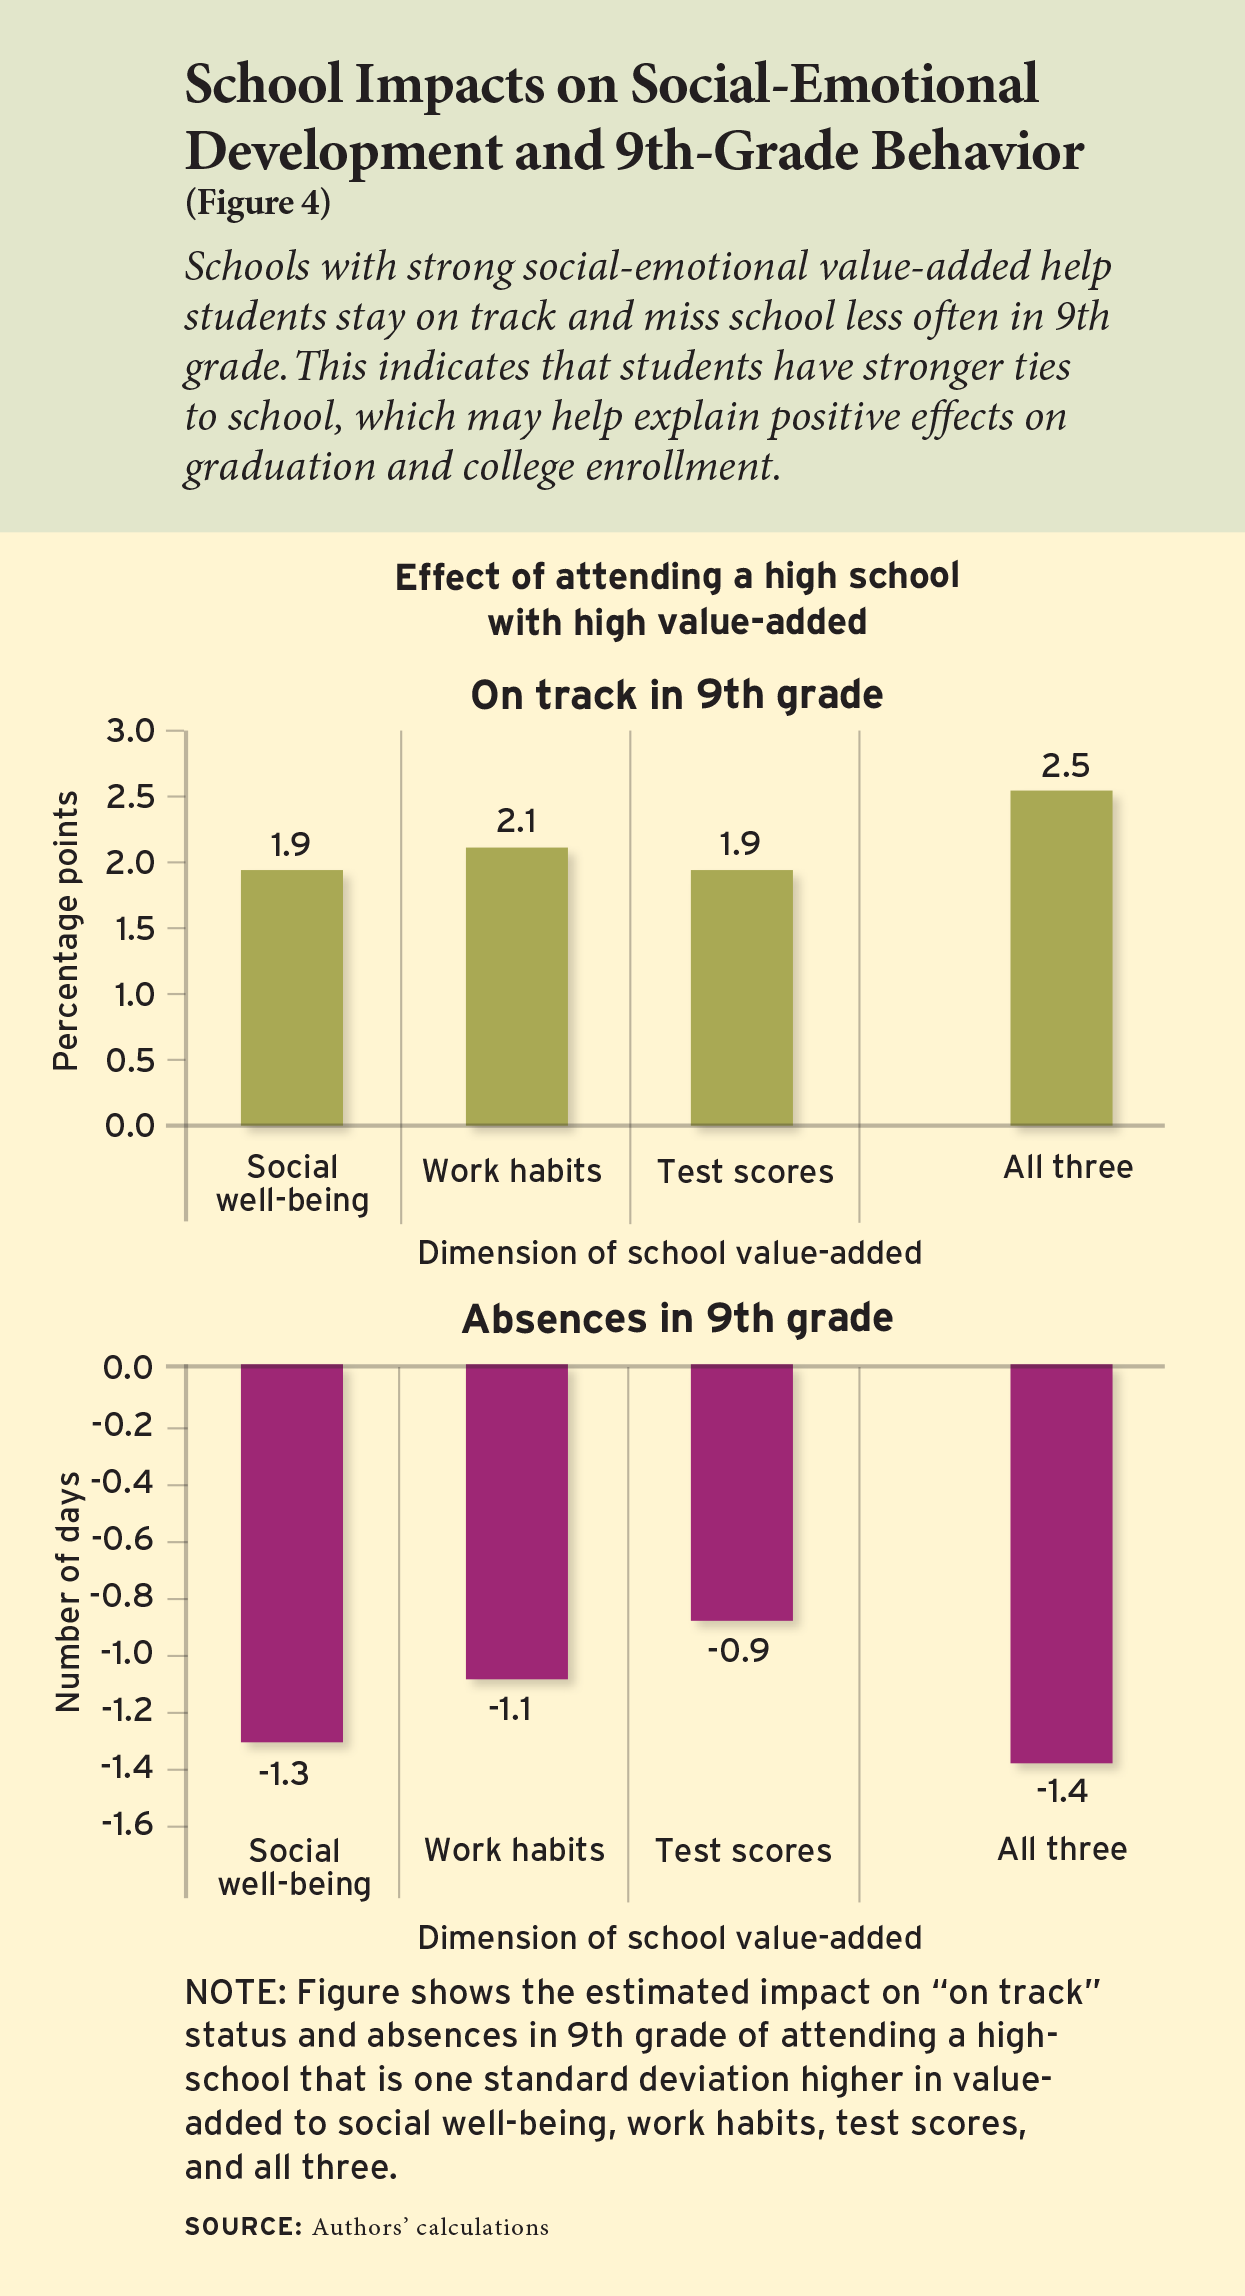
Schools with high social-emotional value-added have larger impacts on students’ on-track status than schools with high test-score value-added. A school that is one standard deviation higher in test-score value-added improves on-track rates by 1.9 percentage points. The gains from attending a school with high value-added to social well-being or work habits are 1.9 and 2.1 percentage points, respectively. A school that has high value-added across all three dimensions improves on-track rates by as much as 2.5 percentage points. This indicates that much of what high schools do to keep students on track to graduate is not captured by impacts on standardized tests. And it tells us that school impacts on self-reported survey measures capture more of a school’s impact on staying on track than impacts on test scores.

School attendance in 9th grade is another important predictor of high-school graduation. All three value-added measures predict absence rates, but value-added to social well-being, which reflects the strength of students’ connections to school and relationships with their peers, tells us more about how often a student will miss school than the other two. An increase of one standard deviation in a school’s test-score value-added reduces absences by 0.9 days in 9th grade. By comparison, an increase of one standard deviation in value-added to social well-being reduces absences by 1.3 days—roughly an 8.6 percent reduction compared to the average numbers of days a student is absent. This larger impact of value-added to social well-being is consistent with earlier findings that students who feel a greater sense of belonging are more likely to attend school.

Finally, we examine impacts on the number of disciplinary incidents in 9th grade and school-based arrests throughout high school. Both value-added to social well-being and test-score value-added predict fewer incidents, while work-habits value-added does not. An increase of one standard deviation in value-added to social well-being reduces the number of incidents by about 1 percentage point compared to 0.8 percentage points for test score value-added. Social-emotional value-added also has a greater effect and more predictive power than test scores when looking at school-based arrests. High value-added to social well-being reduces the likelihood of an arrest by 0.7 percentage points and high work-hard value-added leads to a reduction of 0.8 percentage points. Increasing test-score value-added reduces the likelihood of an arrest by 0.6 percentage points. Using all three value-added measures, the effect of attending a school that is stronger along all three dimensions is 0.9 percentage points. This represents a decrease of about 21 percent compared to the probability of a school-based arrest across all students.

Expanding the Definition of a “Good” School

The high-school years are formative, and attending a high-performing high school can build a foundation for success in adulthood. But what do we mean by high-performing? What are our metrics for success? Our study provides fresh answers to these enduring questions.

We find that some high schools are better than others at helping students develop healthy social lives, community connections, and the skills and habits that promote hard work and grit. We also find that students who attend such a school are more likely to experience positive outcomes in school and after graduation, from being more likely to attend a four-year college to having less interaction with the criminal-justice system. We focus our analysis on students in 9th grade. This transition year is an important window of opportunity to establish strong ties to school.

This is the first broad effort to validate measures of school impacts on social-emotional development that are based on self-report surveys, and our evidence shows that these estimates are arguably causal. Our finding that school impacts on social-emotional growth have larger effects on short- and long-term outcomes than schools’ impacts on test scores has important implications for how policymakers measure school quality.

We also show the potential for surveys to identify high-performing schools using more diverse indicators of success, at least in a low-stakes environment. Surveys reveal that schools that raise test scores are not always those that improve students’ social-emotional development, and vice versa. These results suggest that school quality is multidimensional and show that value-added estimates of impacts on social-emotional growth predict impacts on longer-term outcomes that are not captured by measures of a school’s value-added to test scores.

We conclude with a central question: which school practices improve social-emotional development? While much work remains to be done, our analysis represents an important early step toward a fuller picture of how schools influence student success.

C. Kirabo Jackson is the Abraham Harris Professor of Education and Social Policy at Northwestern University, where Sebastián Kiguel is a PhD student. Shanette C. Porter is director of research and a senior fellow at the Mindset Scholars Network. John Q. Easton is a senior fellow at the UChicago Consortium on School Research, where Alyssa Blanchard is a research analyst. This article is adapted from a study titled “School Effects on Socio-emotional Development, School-Based Arrests, and Educational Attainment,” forthcoming from American Economic Review: Insights.

The post Linking Social-Emotional Learning to Long-Term Success appeared first on Education Next.

get headlines https://thecherrycreeknews.com

How poverty rates are cherry-picked to score political points

“There are roughly 14 million people living in relative poverty this year. In 2000, there were roughly 14 million people living in relative poverty. Why were Labour not able to fix the problems of relative poverty when they were in power?”Dr Kieran Mullan MP, 21 October 2020

“Perhaps the hon. Gentleman would like me to enlighten him on the poverty figures during Labour’s period in office. In 2010-11, there were 3.5 million children living in relative poverty. Today, the figure after housing costs is 4.2 million.”

Kate Green MP, 21 October 2020

On Wednesday, Conservative and Labour MPs both presented official statistics to criticise the other side’s record on tackling poverty. In the process, they both proved why our current statistics can be cherry-picked to obscure what is really happening with poverty in the UK. 

What’s the problem?

There are so many different ways to measure changes in poverty that it is often easy to find one to support almost any argument you want to make. 

What we know about poverty is also subject to delay. So when, last week, Dr Kieran Mullan MP and Kate Green MP talked about the poverty rates “today”, they were actually using data from 2018/19, which is the most recent available. This could be very important, if poverty rates have changed significantly since 2018/19, given the large economic impact of the coronavirus pandemic.

And this is before we look closely at the details. Both Dr Mullan and Ms Green talked about relative poverty. This is only one of the measures available (we’ll talk about the others later). If we look at the overall rate of relative poverty since the mid-1990s—the black line—it shows little change in recent years, after a slight fall around the turn of the century.

The relative poverty rate among children has been slightly more volatile, and the fall among pensioners in the first decade of the century was very pronounced. Each MP chose a different piece of this data, with which to prove their point. 

Dr Mullan’s claim

Dr Mullan claimed that the number of people in relative poverty is around 14 million “now”, and that this is the same as it was in 2000, when Labour was in power.  

By the government’s measure, someone is in relative low income if their household income is below 60% of the national median average that year. This can be calculated both before and after housing costs.

The number of people in relative low income after housing costs in 2000/01 was 13 million (23% of the population). In the latest figures for 2018/19 it is 14.5 million (22% of the population). These are not quite comparable, as the 2000/01 figure is just for Great Britain, while the 2018/19 figure is for the whole of the UK. 

Given that Dr Mullan seems to have been commenting on the progress (or lack thereof) made by the past Labour administration on this issue, it seems odd to compare one set of figures after three years of Labour government with another after eight years of Conservative-led government. 

The population was also growing during this period, which is why it also makes more sense to look at the proportion of the population in relative poverty, not just the raw number.

In 1996/97, the year before Labour came to office, the number of people in relative low income in Great Britain was 14 million, or 25% of the population. In their final year in office (2009/10) there were 13.6 million people in relative low income in the UK, or 22% of the population. However, this is only one way of looking at the figures.     

Ms Green’s claim

Ms Green’s figures are largely accurate.

In 2010/11 there were 3.6 million children (not 3.5 million) in relative poverty after housing costs. In 2018/19 this was, as claimed, 4.2 million. 

However, while Ms Green did not say so explicitly, the choice of 2010/11 seems to suggest she was responding to Dr Mullan’s assessment of Labour’s record with assessment of  the Conservative-led governments, which began in 2010.

If so, the exact choice of year is important. As you can see on the graph above, relative child poverty fell sharply between 2009/10 and 2010/11. The Conservative-led coalition government took power in May 2010, meaning the party was in government for almost the whole of the 2010/11 financial year. 

If you assess its record from that year, the party does not get credit for a fall in poverty that happened almost entirely when it was in power. If you assess it from the year before, it looks like the Coalition government was responsible for an immediate and dramatic improvement in relative child poverty in its first year. 

This also sets the baseline for the next 10 years. Choose 2009/10 as the starting point and child relative poverty has not changed under the Conservatives. Choose 2010/11, and it has got worse. 

Ultimately this shows that it is simplistic to assess any government’s record on something like poverty without looking at all the measurements in context.

Measure for measure

We’ve already talked about how relative poverty can be taken before housing costs or after housing costs, and how it can be expressed as an absolute number of people or a percentage of the population. Not to mention the many different periods and groups of people you could choose to look at. 

And even that is not all the ways in which you could spin different narratives about poverty rates in the UK.  

There is also absolute poverty, a different measure, which looks at the number of people in households where the income is below 60% of the average median level in 2010/11, adjusted for inflation. This sometimes tells a different story.

Then there is the Social Metrics Commission (SMC), an independent panel, which has created a new measure of relative poverty—which also shows that the poverty rate over the past two decades has remained fairly flat among children and working-age adults but fallen for pensioners. 

And the Department for Work and Pensions has said that after reflecting on the work of the SMC, it too is due to publish another set of experimental poverty statistics alongside its usual data release later this year, giving MPs of all stripes yet another poverty dataset with which to debate.

Stay informed: https://northdenvernews.com

Description
Due to the unprecedented crisis caused by the COVID-19 pandemic, BRIO has dedicated 100% of their operations to importing critically needed respirator masks. Featuring a 3D comfort design, these KN95 masks provide filtration against particulate pollution, gases, as well as bacteria, viruses, and most odors. It's made with comfortable stretch fabric and has convenient earloops for a tight fit. These masks are perfect for everyday wear. Order your 5-Pack now!
  • 3D Comfort mask design
  • Convenient earloop design
  • Comfortable stretch fabric for tight fit
  • Easy to put on & remove
Note: These masks are not FDA approved nor are they N95. These masks are tested to meet the standards for Chinese KN-95. Tests confirmed almost 90% of particulate pollution, bacteria and viruses were successfully filtered when the mask was used. 20x more effective than cloth masks.
Specs
  • Color: white
  • Materials: 3-layer melt-blown non-woven PPE
  • Product dimensions: 1"H x 8"L x 5"W
  • 3D Comfort design
  • KN95 PRC Standard (Similar to NIOSH N95)
  • CE 0194
  • FFP2 - EN149 Filtration Level

Teflon in masks does not pose a health danger, unless you get it really hot

A post on Facebook has claimed that disposable masks are sprayed with Polytetrafluoroethylene (PTFE) – also known as Teflon –  and that exposure to this can lead to symptoms including fever, chest tightness, shortness of breath, headache, cough, chills and a sore throat. 

It is true that PTFE is used in some masks, but it is extremely unlikely to cause illness during normal use.

PTFE is most commonly known by the brand name Teflon and is found in items such as non-stick cookware, some clothing, and various medical instruments. 

Blue surgical face masks, like the ones featured in the Facebook post, are most commonly made out of a different type of plastic called polypropylene rather than PTFE, although PTFE is used in the making of some reusable masks, and some disposable masks can have PTFE filters.

The post seems to be referring to the symptoms of polymer fume fever, which is a rare ailment caused by inhaling fumes from PTFE heated above 300 to 400 degrees Celsius, such as when a Teflon pan is overheated. Symptoms can resemble flu, like those in the post. 

There is no evidence that anyone would suffer from this condition as a result of the normal wearing of a mask made with Teflon unless they were inhaling fumes from the burning of the mask.

Best local news: https://northdenvernews.com/category/latest/

Description
Due to the unprecedented crisis caused by the COVID-19 pandemic, BRIO has dedicated 100% of their operations to importing critically needed respirator masks. Featuring a 3D comfort design, these KN95 masks provide filtration against particulate pollution, gases, as well as bacteria, viruses, and most odors. It's made with comfortable stretch fabric and has convenient earloops for a tight fit. These masks are perfect for everyday wear. Order your 5-Pack now!
  • 3D Comfort mask design
  • Convenient earloop design
  • Comfortable stretch fabric for tight fit
  • Easy to put on & remove
Note: These masks are not FDA approved nor are they N95. These masks are tested to meet the standards for Chinese KN-95. Tests confirmed almost 90% of particulate pollution, bacteria and viruses were successfully filtered when the mask was used. 20x more effective than cloth masks.
Specs
  • Color: white
  • Materials: 3-layer melt-blown non-woven PPE
  • Product dimensions: 1"H x 8"L x 5"W
  • 3D Comfort design
  • KN95 PRC Standard (Similar to NIOSH N95)
  • CE 0194
  • FFP2 - EN149 Filtration Level

Monday, October 26, 2020

An Optimistic Obtains Real About the Restrictions of Schooling

Fredrik deBoer argues that America’s much-vaunted meritocracy is actually an aristocracy, given that today’s rich and powerful did not earn their “just desserts,” but simply won their stations in life by lucking into the best genes.

The Cult of Smart
by Fredrik deBoer
All Points Books, 2020, $28.99, 276 pages.

As reviewed by Michael J. Petrilli

To say that the premise of this book is provocative is like saying LeBron James is a good basketball player.

Fredrik deBoer, an academic, internet gadfly, and self-described Marxist, argues that America’s much-vaunted meritocracy is actually an aristocracy, given that today’s rich and powerful did not earn their “just desserts,” but simply won their stations in life by lucking into the best genes. Likewise, the losers of the knowledge economy never had a chance, given their inferior intellectual inheritance. Education reform, then, is worse than pointless, because academic outcomes are largely determined at the moment of conception. “Educational achievement,” he claims, “is significantly heritable—that is, it passes from parent to child genetically, with biological parentage accounting for half or more of the variation.” We should abandon the ruse that “educational equality,” much less “equality of opportunity,” can ever be achieved and instead overthrow capitalism and redistribute income in order to attain equality of outcomes. As Andrew Sullivan wrote in his review of the book, it’s “Bell Curve Leftism” in its purest form.

As a Burkean conservative and fully committed education reformer, I am not the target audience for this book. Like any respectable policy wonk, I try to keep an open mind, but I have my limits. I am not likely to be persuaded to join the revolution, embrace the radical left, and give up on democratic capitalism.

Cover of The Cult of SmartMuch of the author’s argument rests on a shaky—even silly—caricature of the American meritocracy today. “The cult of smart,” deBoer explains, “is the notion that academic value is the only value, and intelligence the only true measure of human worth. It is pernicious, it is cruel, and it must change.”

What world is he living in? Who actually holds these beliefs, that academic value is the only value, and intelligence is the only true measure of human worth? DeBoer admits to spending his whole life in college towns, around academics. In those ivy-clad enclaves, and in the hyper-educated neighborhoods where we Bobos raise our young, yes, there’s an obsession with GPAs and SATs, in getting our kids into the most selective universities so that the next generation can rinse and repeat. But such places are bubbles, micro-cultures, niches. They aren’t the entirety of America. Go into a typical high school and find out who the popular kids are. The honors students or the athletes? If our country has a cult, it has always been the Cult of Anti-Intellectualism.

There was a time no so long ago when the education reform movement was myopically focused on test scores and college completion. Since then, though, the pendulum has swung dramatically to embrace “social and emotional skills” and career training as well—a development deBoer seems to have missed.

Nor does deBoer succeed in making the case that only the academically gifted enjoy affluence and status in our society today. Yes, back in the bubble, and especially in big cities like New York, Washington, and San Francisco, there’s a huge divide between the highly educated, highly paid “creative class,” on the one hand, and poorly educated, low-wage service sector workers on the other.

In the heartland, however, millions of well-paid jobs are held by people without four-year degrees, much less degrees from fancy colleges. Those jobs may or may not be intellectually demanding in ways that could be related to IQ, but they require myriad other strengths and qualities, from sociability to technical prowess to integrity to stick-to-it-iveness. And in that America, where people have lives and not just careers, status need not come from your job title or position description alone, but from your role as the Little League baseball coach, Sunday school teacher, president of the Rotary, or star in the church choir.

***

Still, deBoer’s central claim about academic differences—that some individuals are born lucky, with lots of intellectual potential, while others are not—deserves attention. It forces all of us working in education to ponder whether we have been kidding ourselves. In particular, have we been engaging in happy talk about how much progress is possible for the academically least talented?

DeBoer would want me to pause here and point out—as he does repeatedly—that he is talking about individual, and not group, differences. “The assumption that a link between genetic ancestry and academic ability must necessarily imply genetic group differences among races is a category error,” he writes. “It’s perfectly consistent to believe that the difference between individual students is largely genetic while the difference between racial groups is not.”

Fredrik deBoer
Fredrik deBoer

Still, if it’s true that intelligence is largely inherited—and that parenting and other environmental factors play a fairly minimal role, as deBoer argues—the implications for educational equity are profound. He acknowledges many of them. Any achievement gains from early childhood education, for example, will continue to fade out, “if we assume that there is some underlying academic deficit that asserts itself more the older a child gets.” So it goes, really, for all educational investments—we shouldn’t expect any of them to do much good in terms of closing achievement gaps. Not that deBoer is against spending more money on various educational initiatives. “I in fact think we have a moral duty to do so,” he writes.

He also has little praise for rigorous academic standards, given that he believes they are impossible to meet for so many students. “I argue that you should accept lower standards in order to keep more students in the system and spare those who will never meet the more rigorous standards from the frustration and humiliation of failure,” de Boer explains.

Even more controversial is his solution for what to do with the lowest-achieving students, those who can’t meet even those lesser standards: let them drop out at age 12. “There will always be a portion of adolescents who have no interest in continuing formal schooling,” he argues, “and forcing them to do so not only impinges on their freedom but wastes time, energy, and resources better spent on those who want to be in school.” And if such dropouts can’t get a job? No problem—the government will provide.

***

Viewed in a certain light, deBoer’s argument has its own internal consistency. As a Marxist, he wants to see our capitalist system overthrown and replaced with an expansive version of socialism. He has no use for education policies that increase achievement across the board; if they don’t narrow gaps between the left and right sides of the bell curve while also narrowing income gaps, they don’t interest him much.  Indeed, he acknowledges that IQs have been increasing over time—a phenomenon known as the Flynn Effect—and accepts that the National Assessment of Educational Progress showed gains as well in the not-so-distant-past. And he concedes that “there are interventions that can ameliorate some of the impact of genes,” that “individual students change their academic position relative to their peers often.”

But deBoer is not a “rising tide lifts all boats” kind of guy. “At scale,” he writes, “the trends are undeniable—and it’s at scale that our policy apparatus must operate.” As long as there are winners and losers in the genetic lottery—in other words, as long as forever—he thinks we should reject the whole liberal democratic capitalist project and opt for a People’s Republic instead.

I suspect few readers of Education Next are ready to go along with all of that. But we might nonetheless take from deBoer a new sobriety about what is achievable by even the best schools. Such a clear-eyed realism is not brand-new, of course; it’s what Charles Murray argued for in his 2009 book Real Education too (see “Reality Check,” Vol. 9 no. 1).

A reality-based approach would start by celebrating progress (both academic and economic) across-the-board rather than obsessing about whether various gaps are closing. That’s because human flourishing is not a zero-sum game. We should want all young Americans to learn as much as they can, to come as close as possible to achieving their full potential, even if that potential is not evenly distributed. We should want our high-IQ students to become high-achieving students and go on to cure diseases and write great novels and solve climate change and all the rest. And we should want our low-IQ students to learn as much as they can too, both so they live more fulfilling lives and so they can participate more fully in our democracy and economy.

Perhaps most importantly, when setting goals for our schools we should avoid both utopianism and defeatism. No, not everyone can achieve true “college and career ready” standards. But there’s also no reason to believe, as deBoer seems to, that most of our low-performing students today are anywhere close to hitting a ceiling on what they might learn or what they might do.  Virtually all children in America could perform at a higher level than they do today, and it’s more likely to happen tomorrow if we stop undervaluing and under-developing our nation’s human-capital potential.

Despite his radical politics and uneven arguments (including his ridiculous claims about charter schools), we shouldn’t entirely dismiss deBoer. He’s right that those of us in education—and especially in education reform—are uncomfortable talking about individual differences in academic talent. We prefer to pretend they don’t exist. Without addressing this basic, indisputable fact of human diversity in a straightforward way, we tend to set goals that are impossible to achieve, that encourage schools to ignore the needs of their most talented students, and that breed frustration, cynicism, and anger among front-line educators. Even though he’s a utopian, deBoer’s most important role, then, is to bring a healthy dose of realism to the education endeavor.

Michael J. Petrilli is president of the Thomas B. Fordham Institute, visiting fellow at Stanford University’s Hoover Institution, and an executive editor of Education Next.

The post A Utopian Gets Real About the Limits of Schooling appeared first on Education Next.

By: Michael J. Petrilli
Title: A Utopian Gets Real About the Limits of Schooling
Sourced From: www.educationnext.org/utopian-gets-real-about-limits-of-schooling-book-review-cult-of-smart-deboer/
Published Date: Mon, 26 Oct 2020 09:01:47 +0000

The Education And Learning Exchange: Closing Schools Does Not Maintain Children Safe

An Associate Professor of Ecomonics at the Naval Postgraduate School, Ryan Sullivan, joins Paul E. Peterson to discuss Sullivan’s recent op-ed, which outlines why schools should resume in-person classes.

End the School Shutdown,” an op-ed Sullivan co-wrote with David R. Henderson in the Wall Street Journal, is available now.

The post The Education Exchange: Closing Schools Does Not Keep Kids Safe appeared first on Education Next.

By: Education Next
Title: The Education Exchange: Closing Schools Does Not Keep Kids Safe
Sourced From: www.educationnext.org/the-education-exchange-closing-schools-does-not-keep-kids-safe/
Published Date: Mon, 26 Oct 2020 08:59:58 +0000

Picture of Man in Halloween Outfit Isn’t Mark Kelly

Quick Take

Social media posts, including one retweeted by Donald Trump Jr., falsely claim that a yearbook photo shows Democratic Senate candidate Mark Kelly dressed as Hitler for Halloween. Kelly’s campaign and several of his former classmates told FactCheck.org that the photo is not of Kelly.


Full Story

Drawing on a report from a conservative news site, several social media posts claim — without evidence — that Mark Kelly, a Democrat running for a U.S. Senate seat in Arizona, was photographed in an Adolf Hitler costume at a 1985 Halloween party at the U.S. Merchant Marine Academy.

“Breaking: Yearbook Photo emerges of AZ (D) Senate candidate Mark Kelly dressed as Adolf Hitler!” reads one Facebook post that racked up more than 2,600 shares in less than a day.

Another post, by the group “President Trump Fans,” includes images of a tweet by the reporter who originated the story on Oct 23.

The president’s son, Donald Trump Jr., also retweeted the story the day it was published in National File, a conservative web outlet founded in 2019 that has previously trafficked in misinformation, as we’ve reported. 

The allegation about Kelly is baseless.

There is no identifying information linking Kelly to the photo, and numerous classmates told FactCheck.org that it wasn’t him. Representatives for Kelly, who is perhaps best known as a former NASA astronaut and husband to former U.S. Rep. Gabby Giffords, also denied that he is in the photo.

“The website that published this has been unable to provide any evidence or verification of their original claim — and that’s because it is not true,” said Kelly’s communications director Jacob Peters in an email.

National File states in its report that it “has obtained yearbook photos that show Mark Kelly dressed as Hitler for Halloween,” but provides no evidence to support that claim. The photos in question are black and white and show a young white man in aviator sunglasses with a mustache and a swastika armband. 

The article does not include any sources who say the person in the Hitler costume is Kelly. One piece of circumstantial evidence, the story suggests, is that Kelly is photographed wearing similar sunglasses on his yearbook’s senior page.

We found the photos National File purportedly unearthed online in a publicly available scanned copy of the 1986 yearbook. Photos of a costumed Hitler appear on two pages, neither of which are captioned to provide identifying information.

Shortly after publication of the allegation, the Kelly campaign issued a statement saying that Kelly was not in the Hitler photos and “he never dressed up in such a costume.”

“The story is false and should be retracted immediately, and those who have spread this misinformation online should delete it,” said campaign manager Jen Cox. “Anyone using it to try to smear a combat veteran should be ashamed of themselves.”

The campaign also relayed statements from five classmates who said the person dressed as Hitler was not Kelly. The Arizona Republic also wrote a story detailing Kelly’s denial and that of four classmates. 

National File then published a second story claiming that Kelly’s classmates went “dark” after their Friday statements, suggesting that those statements might have been fabricated by the campaign, since it was unclear if the Arizona Republic reporter had spoken directly with those individuals.

FactCheck.org can confirm that Kelly’s classmates did not go “dark,” as we subsequently spoke by phone to two classmates who gave statements to the campaign.

Ed McDonald verified that he was a classmate of Kelly’s, had attended the Halloween mixer, and that Kelly was not dressed as a Nazi. He added that the people in the photo were from Second Company — a different company from Kelly’s.

McDonald said he first heard about the allegation from fellow classmate Jennifer Boykin, and that when he went to consult his yearbook, he “immediately” knew that the costumed Hitler was not Kelly.

Peter Lindsey, another classmate who provided a statement to the campaign, also confirmed similar details in a phone call with FactCheck.org, saying that he and his classmates were in “incredulous shock that this even came up.” 

Noting that he is a Republican and that he contacted the Kelly campaign — not the other way around — Lindsey said Kelly was not in the Halloween photos, and that since Kelly was as a regimental officer who was in charge of the plebes, or freshmen, the concept that Kelly would dress as Hitler was preposterous.

It’s “inconceivable” that someone in Kelly’s position would have worn a Nazi costume two months into the school year, he said, noting that Kelly “wasn’t the kind of guy to do that” anyway.

Lindsey further said that he had been contacted by someone on LinkedIn about six weeks ago who asked him if Kelly was in a particular photo. The photo was similar to one of the Halloween photos in the yearbook, but did not obviously show that the person was dressed as Hitler and did not show a swastika. 

In screenshots of the exchange that were shared with FactCheck.org, Lindsey replied that the photo was grainy, but that the person did not look like Kelly — and that the other people he recognized in the photo were from a different “battalion / company,” so he “highly doubt[ed]” that it was Kelly.

The LinkedIn request came from Karim Addetia, who claimed to be a research and communications intern at the Center for Responsible Enterprise and Trade.

The Kelly campaign has identified Addetia as a consultant with the Senate Leadership Fund, a super political action committee dedicated to expanding the Republican Senate majority. According to Federal Election Commission filings, the super PAC has paid Addetia nearly $29,000 this year and the group has spent more than $31 million in an effort to defeat Kelly in his race against Republican Sen. Martha McSally.

Three additional classmates also told us Kelly was not in the Halloween photos. We independently reached out to the two contacts listed on the Merchant Marine Academy’s alumni website, and both 1986 class representatives told us by email that Kelly was not in the Hitler photos.

“It is absolutely not Mark Kelly,” said Geoff Pletcher.

“I was at the Halloween party in 1985, in fact – I am one of the ‘jail birds’ in the bottom left photo,” said Connie Dato English. “The person in question in the middle photo is not Mark Kelly, nor a public figure. I can say unequivocally that Mark Kelly is not pictured on that page at all.”

Joe Martino, the 1986 class president, also said in a phone call that the Hitler figure was not Kelly. He added that he had heard from at least five other classmates who said the same.

Martino, too, noted that the people he recognized in the photo were from Second Company — and said that given that Kelly was second in command of his regiment, it was hard to imagine him even attending the party.

“For him to even be at this party, in costume of any kind,” he said, is “hard to figure.”

Editor’s note: FactCheck.org is one of several organizations working with Facebook to debunk misinformation shared on social media. Our previous stories can be found here.

This fact check is available at IFCN’s 2020 US Elections FactChat #Chatbot on WhatsApp. Click here for more.

Sources

Howley, Patrick. “EXCLUSIVE: Democrat Senate Candidate Mark Kelly’s Yearbook Shows Him Dressed As Hitler.” National File. 23 Oct 2020.

Trump, Donald Jr (@DonaldJTrumpJr). “‘Trump is literally Hitler’ Nope, but apparently Mark Kelly is!” Twitter. 23 Oct 2020.

Schaedel, Sydney. “Donald Trump Jr. Shares Unsupported Claim that ‘Democrats’ Vandalized Statue.” FactCheck.org. 10 Jul 2020.

Peters, Jacob (@JacobNPeters1). “Those photos are not of Mark Kelly. See statements from our campaign manager and one of Mark’s classmates who attended this event #AZSEN.” Twitter. 23 Oct 2020.

Peters, Jacob. Communications Director, Mark Kelly for Senate. Email to FactCheck.org. 25 Oct 2020.

The United States Merchant Marine Academy. “Midships 1986.” Yearbook. Accessed 24 Oct 2020.

U.S. Merchant Marine Academy Alumni Association and Foundation. “Class of 1986 – Info Page.” Accessed 24 Oct 2020.

Wingett Sanchez, Yvonne. “Mark Kelly classmates say report on yearbook photo by right-wing media site is false.” Arizona Republic. 23 Oct 2020.

Howley, Patrick. “Mark Kelly Classmates Go Dark After Friday Night Statements To AZ Central About Mark’s Hitler Photos.” National File. 23 Oct 2020.

McDonald, Ed. Classmate of Mark Kelly. Phone interview with FactCheck.org. 24 Oct 2020.

Lindsey, Peter. Classmate of Mark Kelly. Email and phone interview with FactCheck.org. 24 Oct 2020.

Disbursements | Karim Addetia. Federal Elections Commission. Accessed 25 Oct 2020.

Independent expenditures | Senate Leadership Fund. Federal Elections Commission. Accessed 25 Oct 2020.

Independent expenditures, FEC filing 1465504 for Senate Leadership Fund. Federal Elections Commission. Accessed 25 Oct 2020.

Schedule A, Defend Arizona. Federal Elections Commission. Accessed 25 Oct 2020.

Pletcher, Geoff. USMMA Class of 1986 Class Agent. Email to FactCheck.org. 24 Oct 2020.

English, Connie Dato. USMMA Class of 1986 Class Agent. Email to FactCheck.org. 24 Oct 2020.

Martino, Joe. 1986 U.S Merchant Marine Class President. Email and phone interview with FactCheck.org. 25 Oct 2020.

The post Photo of Man in Halloween Costume Isn’t Mark Kelly appeared first on FactCheck.org.

Get more news: https://www.northdenvernews.com

Description
Due to the unprecedented crisis caused by the COVID-19 pandemic, BRIO has dedicated 100% of their operations to importing critically needed respirator masks. Featuring a 3D comfort design, these KN95 masks provide filtration against particulate pollution, gases, as well as bacteria, viruses, and most odors. It's made with comfortable stretch fabric and has convenient earloops for a tight fit. These masks are perfect for everyday wear. Order your 5-Pack now!
  • 3D Comfort mask design
  • Convenient earloop design
  • Comfortable stretch fabric for tight fit
  • Easy to put on & remove
Note: These masks are not FDA approved nor are they N95. These masks are tested to meet the standards for Chinese KN-95. Tests confirmed almost 90% of particulate pollution, bacteria and viruses were successfully filtered when the mask was used. 20x more effective than cloth masks.
Specs
  • Color: white
  • Materials: 3-layer melt-blown non-woven PPE
  • Product dimensions: 1"H x 8"L x 5"W
  • 3D Comfort design
  • KN95 PRC Standard (Similar to NIOSH N95)
  • CE 0194
  • FFP2 - EN149 Filtration Level

Bogus Claims of Dispute Mediator Predisposition

Quick Take

A tabloid story alleging that Kristen Welker, moderator of the final presidential debate, is politically biased has spawned several falsehoods on social media. Welker hasn’t donated to any federal candidates, and she wasn’t “busted” for revealing a question to the Clinton campaign in 2016.

Full Story

Social media posts are targeting Kristen Welker, an NBC White House correspondent since 2011 who is scheduled to moderate the final presidential debate for the 2020 election on Oct. 22.

The posts aim at discrediting Welker, making her appear to be biased against President Donald Trump. The president called her a “radical Democrat” during a rally in Arizona on Oct. 19.

But Welker, who lives in Washington, D.C., is not currently registered with a political party, according to the District of Columbia Board of Elections. Also worth noting is that Trump praised Welker in January when she was named a co-host of NBC’s “Weekend TODAY” show. Then, he said, “They made a very wise decision.”

Despite that, the posts amplify claims of bias about Welker that were first made in a tabloid story, from the New York Post, on Oct. 17. We’ll go through the most widely shared examples below.

Claim: A 2012 photo with the Obamas proves bias.

Facts: A photo from Welker’s Facebook page shows her at a White House holiday party in 2012. That year, the BBC reported, the White House was planning to host “as many as two dozen holiday parties.”

Visitor logs show that Welker was at the White House on the evening of Dec. 11, 2012, when there was a party attended by other journalists. Presidents have had a tradition of hosting the White House press corps for a holiday party, although Trump stopped the practice during his second year in office.

In 2012, though, then-President Barack Obama held the party and, in the picture, Welker is joined by the president and the first lady beneath a portrait of George Washington. Another, unidentified person is in the picture.

Similar pictures online show the Obamas posing with many others in the same way. Brit Hume, a political analyst on Fox News, took to Twitter to comment on one viral version of the claim, saying, “This is a standard White House Christmas party photo. It means nothing. There are hundreds of these pictures with journalists of all stripes posing with first families of both parties.”

But the story published in the New York Post linked to the photo and claimed, “In 2012, Welker and her family celebrated Christmas at the White House with the Obamas.”

All that the picture shows, though, is that she attended a White House holiday party with numerous colleagues (the White House visitor logs show 700 attended, including some from Fox News) while Obama was president.

Despite that, posts on social media have taken the photo and used it to suggest that Welker is biased.

Claim: Welker is “registered as a Democrat.”

Facts: Welker was a registered Democrat, but she is no longer registered as a member of any political party, Nick Jacobs, spokesman for the District of Columbia Board of Elections, told FactCheck.org in a phone interview.

“She has been unaffiliated with a party since 2016,” he said. Before that, starting in 2012, she was registered as a Democrat.

The New York Post reported that correctly, but some who shared the story on social media with their own commentary didn’t pass along the facts. They claimed that Welker is currently a registered Democrat. Others suggested that her previous party registration was proof of bias.

But just because Welker was once registered as a Democrat doesn’t necessarily indicate anything about her current political preferences, or her ability to fairly cover politicians of both parties. Trump himself was a Democrat for eight years.

Claim: Welker “gave thousands of dollars to Obama, Clinton and Biden.”

Facts: Welker has made no donations to any candidates for federal office at all, according to a search of the Federal Election Commission.

Her parents, however, have contributed to various Democratic campaigns. That was noted in the news story. But, as with some of the other claims, the donations made by Welker’s family members don’t say anything about her personal politics or bias. Social media posts claimed that Welker, herself, had donated. She hasn’t.

Claim: Welker was “Busted Tipping Off Team Hillary in 2016.”

Facts: Some partisan websites posted stories with deceptive headlines suggesting that Welker had provided a debate question to the Clinton campaign ahead of time. No such thing happened.

For example, the Western Journal posted this headline: “Kristen Welker, the Next Debate Moderator, Got Busted Tipping Off Team Hillary in 2016.” That story has been shared more than 55,000 times on Facebook, according to data from CrowdTangle.

Another site, the Post Millennial, published this headline: “FLASHBACK: Final debate moderator busted on hot mic coaching Clinton campaign director.”

But those are exaggerations of a claim from the tabloid story.

The New York Post included a roughly one-minute video clip from the YouTube channel for the conservative Washington Free Beacon. It described the clip this way: “In March 2016 Welker was busted on live television tipping off Hillary Clinton’s Communications Director Jennifer Palmieri about at least one question she planned to ask her during a post-debate interview in Michigan.”

The headlines that followed, as we noted above, dropped the important fact that the claim was based on a few seconds of a post-debate interview, not on a question related to the debate itself. Welker wasn’t the debate moderator, either. It was Anderson Cooper.

The clip shows Welker interviewing Clinton’s communications director, Jennifer Palmieri, after a March 2016 debate in Flint, Michigan. Clinton and Sen. Bernie Sanders were vying for the Democratic presidential nomination at the time.

When the shot moves from the studio to Welker and Palmieri live in Flint, Welker appears to be confirming something to a person off camera, then looks to Palmieri and says, “and I’m going to ask you about Flint.” (Welker was likely referring to the dangerously high lead levels in the city’s drinking water that became an issue during the primary and had come up earlier in the debate.)

There’s a problem with communication between the live shot and the studio and the clip goes back to Ari Melber, the host of the show.

He segues again to Welker, who isn’t shown on screen, but can be heard saying, “I think this is his last question.”

When the camera is on her, she turns to Palmieri and asks for “your initial reaction to tonight’s debate.”

Palmieri begins to answer, but the communication glitch interrupts and prompts Welker to ask the same question again. Palmieri answers again and that’s the end of the clip.

So, it doesn’t even show that Welker asked the question about Flint that she said she would.

That’s not evidence that Welker was “Busted Tipping Off Team Hillary in 2016.” It shows only a reporter and a campaign official engaged in a post-debate interview.

Editor’s note: FactCheck.org is one of several organizations working with Facebook to debunk misinformation shared on social media. Our previous stories can be found here.

This fact check is available at IFCN’s 2020 US Elections FactChat #Chatbot on WhatsApp. Click here for more.

Sources

The Sun. “Live: Trump campaigns in Prescott, Arizona.” YouTube. 19 Oct 2020.

TODAY. “Watch President Trump Congratulate Kristen Welker On Weekend TODAY Role.” YouTube. 25 Jan 2020.

Levine, Jon. “Kristen Welker, upcoming presidential debate moderator, has deep Democrat ties.” New York Post. 17 Oct 2020.

Welker, Kristen. “Christmas at the White House!” Facebook. 13 Dec 2012.

White House visitor records. 2012. Obamawhitehouse.archives.gov. Accessed 21 Oct 2020.

Hume, Brit (@brithume). “This is a standard White House Christmas party photo. It means nothing. There are hundreds of these pictures with journalists of all stripes posing with first families of both parties.” Twitter. 18 Oct 2020.

Jacobs, Nick. Spokesman, District of Columbia Board of Elections. Telephone interview. 20 Oct 2020.

Gillin, Joshua. “Bush says Trump was a Democrat longer than a Republican ‘in the last decade.’” PolitiFact. 24 Aug 2015.

Federal Elections Commission. Search — Kristen Welker. Accessed 21 Oct 2020.

Washington Free Beacon. “MSNBC Reporter Doesn’t Know She’s Live, Tips off Clinton Aide What She’ll Ask Her.” YouTube. 6 Mar 2016.

The post Bogus Claims of Debate Moderator Bias appeared first on FactCheck.org.

earn more: https://thecherrycreeknews.com/category/latest/

Description
Due to the unprecedented crisis caused by the COVID-19 pandemic, BRIO has dedicated 100% of their operations to importing critically needed respirator masks. Featuring a 3D comfort design, these KN95 masks provide filtration against particulate pollution, gases, as well as bacteria, viruses, and most odors. It's made with comfortable stretch fabric and has convenient earloops for a tight fit. These masks are perfect for everyday wear. Order your 5-Pack now!
  • 3D Comfort mask design
  • Convenient earloop design
  • Comfortable stretch fabric for tight fit
  • Easy to put on & remove
Note: These masks are not FDA approved nor are they N95. These masks are tested to meet the standards for Chinese KN-95. Tests confirmed almost 90% of particulate pollution, bacteria and viruses were successfully filtered when the mask was used. 20x more effective than cloth masks.
Specs
  • Color: white
  • Materials: 3-layer melt-blown non-woven PPE
  • Product dimensions: 1"H x 8"L x 5"W
  • 3D Comfort design
  • KN95 PRC Standard (Similar to NIOSH N95)
  • CE 0194
  • FFP2 - EN149 Filtration Level